The Great Bull Resumes
The Great Bull Resumes
Since we began writing these articles we have always maintained the view that the S&P500 index would, sooner or later, break upwards to a series of new record highs. The most recent of those highs was at its 2190 close of 15th August this year. Now that high is being surpassed as markets take comfort from the idea that President-elect Trump intends to implement tax-cuts and some new upside in the oil price.
Of course, behind all this is an American economy which is responding more and more positively to 10 years of unprecedented monetary stimulation. Even Janet Yellen has reached the place where she is probably about to raise interest rates for the second time in this cycle. Business is looking better and better in America – and some of that optimism is spreading to other parts of the world – most notably Europe.
In our view, the overwhelming monetary stimulation of the world economy is at last translating into an increasingly positive attitude from both business and consumers. The lower price of oil has helped by putting more money into every consumer’s pocket world-wide.
Of course, the stock market has known about this resurgence for some time. The S&P500 index bottomed at 666.79 on 6th March 2009. Since then it has been going up – with some impressive sideways and downward moves along the way. But, the sheer size and persistence of the monetary stimulation throughout the world (Europe is still printing 80 billion Euros a month) has avoided what would otherwise have certainly been another great depression.
The long-term trendline of this great bull market begins with the S&P’s low at 666 on 6-3-09 and connects with its first touch point at 1150 on 28-9-2011. The second touch point came earlier this year on 11-2-16 at 1829. Consider the chart:
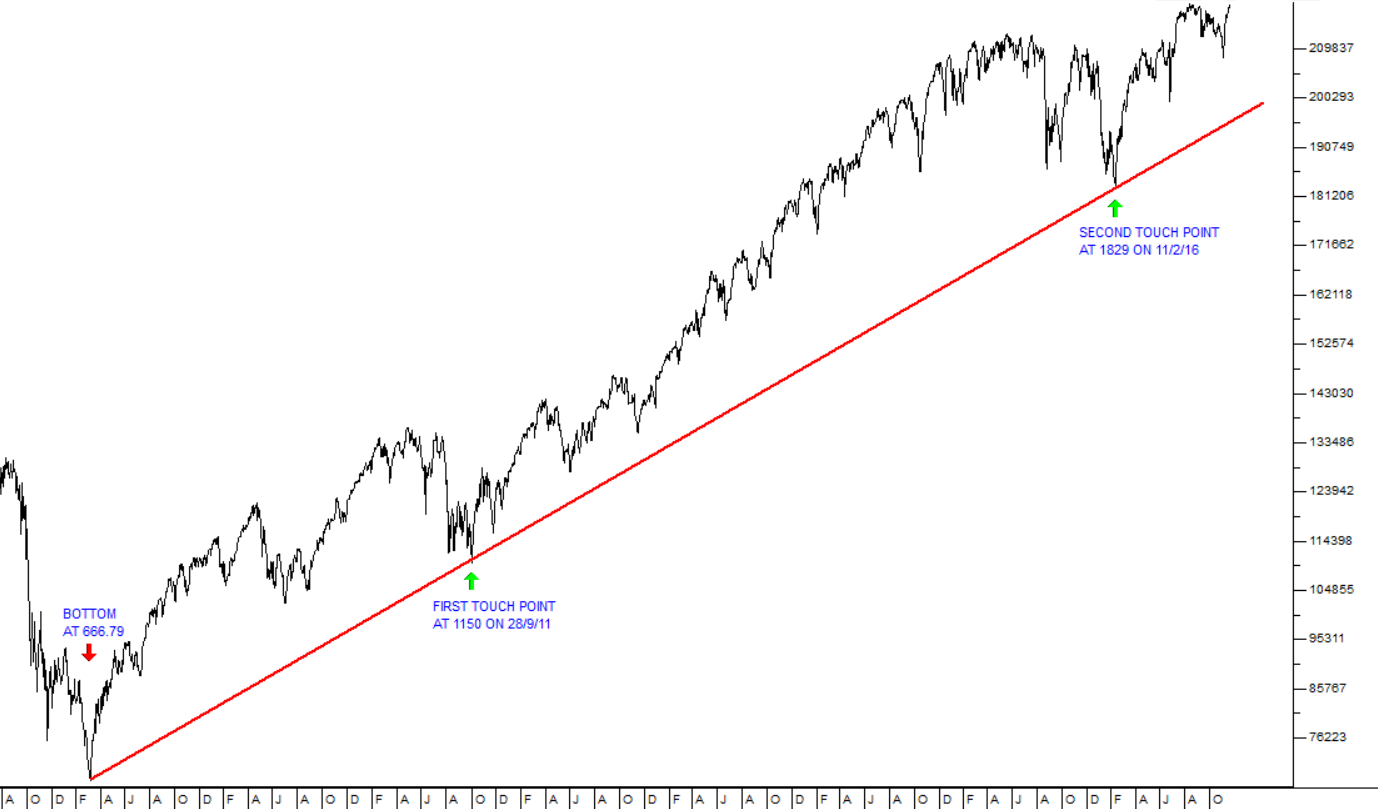
It really is quite remarkable that by connecting the low to the first touch point, you could actually have anticipated the second touch point – which would only come nearly five years later – but such is the nature of technical analysis.
As a private investor you should be looking to “make hay while the sun shines”. In other words you need to be invested in good quality equities to take advantage of what will almost certainly be a resumption of the bull trend of the past 7 years. We believe that this may be the longest and strongest bull market in history.
← Back to Articles