A New Perspective
23 July 2023 By PDSNETSometimes in technical analysis it is possible to gain a better understanding of what is happening in the markets by stepping back and considering the long-term context of where we are now.
The S&P500 index rose to 4565 on Wednesday last week, which is only 4,8% below its all-time record high of 4796 made on 3rd January 2022. From a technical perspective, the current upward move can no longer be characterized as a rally within a bear trend. It now seems certain now that the previous record high will be reached and exceeded fairly soon.
Does this mean that the downward trend, which began on 3rd January 2022 from the record high of 4796 and ended just over 10 months later at the cycle low of 3577 on 12th October 2022, was a bear trend? We think not. The market only fell by 25,4% - which is, historically, nowhere near even the smallest of bear trends. And it only lasted for ten months, which is also noticeably short for a bear trend.
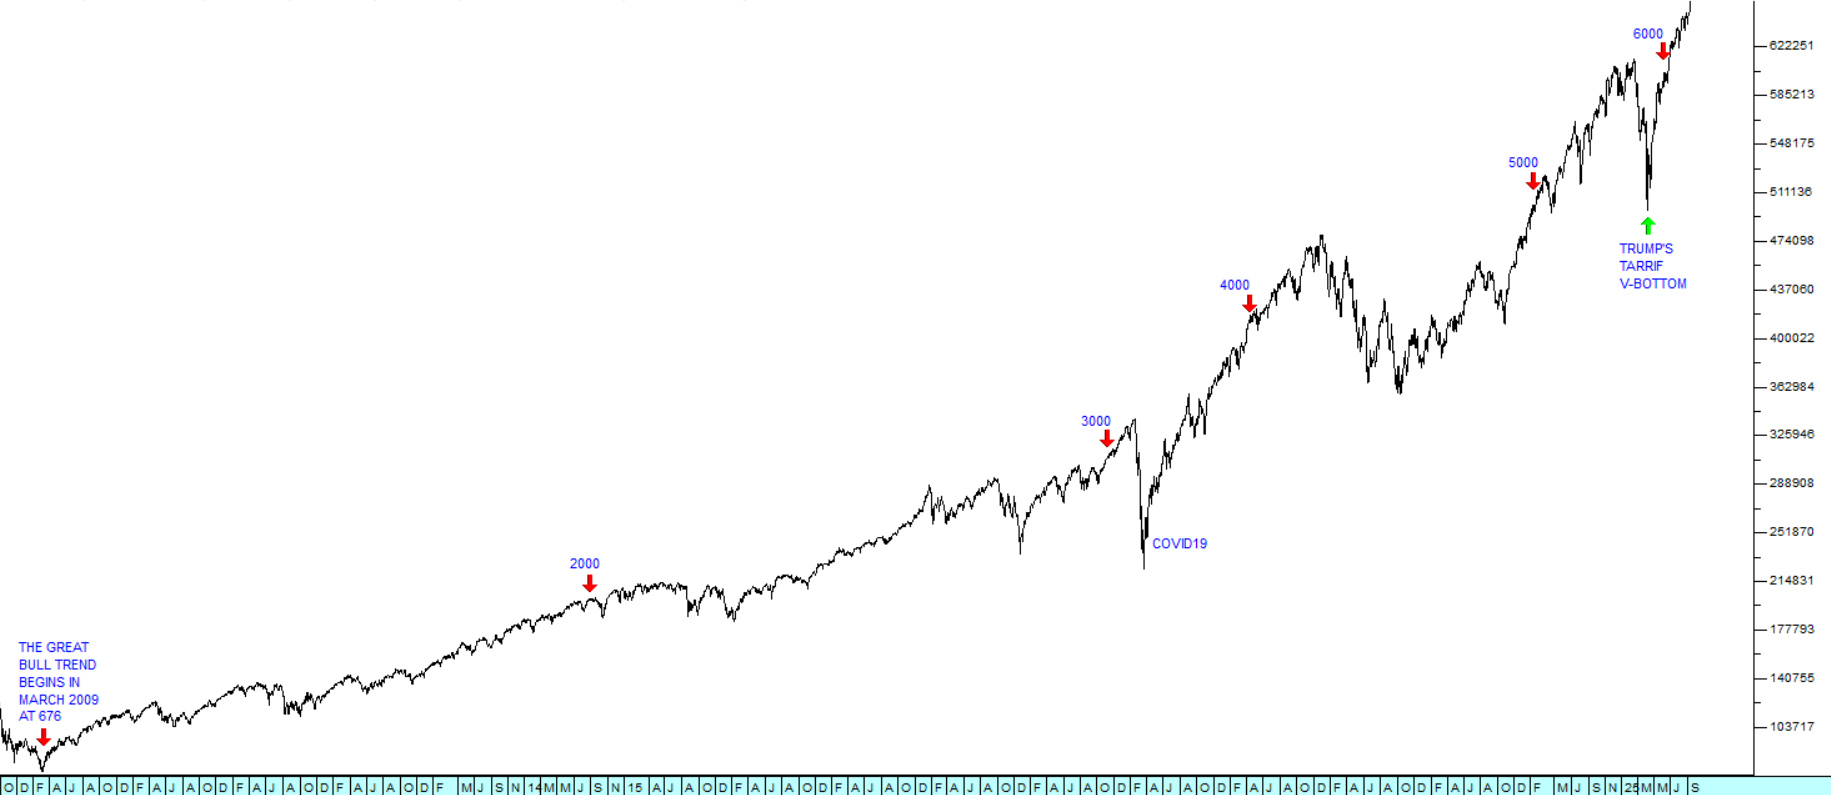
Officially, a bear trend begins when the market falls by more than 20% - but that is an entirely arbitrary percentage used mainly by financial journalists. And we know that the behaviour of this particular market has been heavily skewed by the excessive use of quantitative easing and ultra-low interest rates, firstly following the sub-prime crisis of 2008 and then as a consequence of COVID-19 after 2020. What if this extraordinary monetary stimulation exaggerated the normal patterns associated with markets? Consider the long-term chart of the S&P500 going back to the start of 2009:
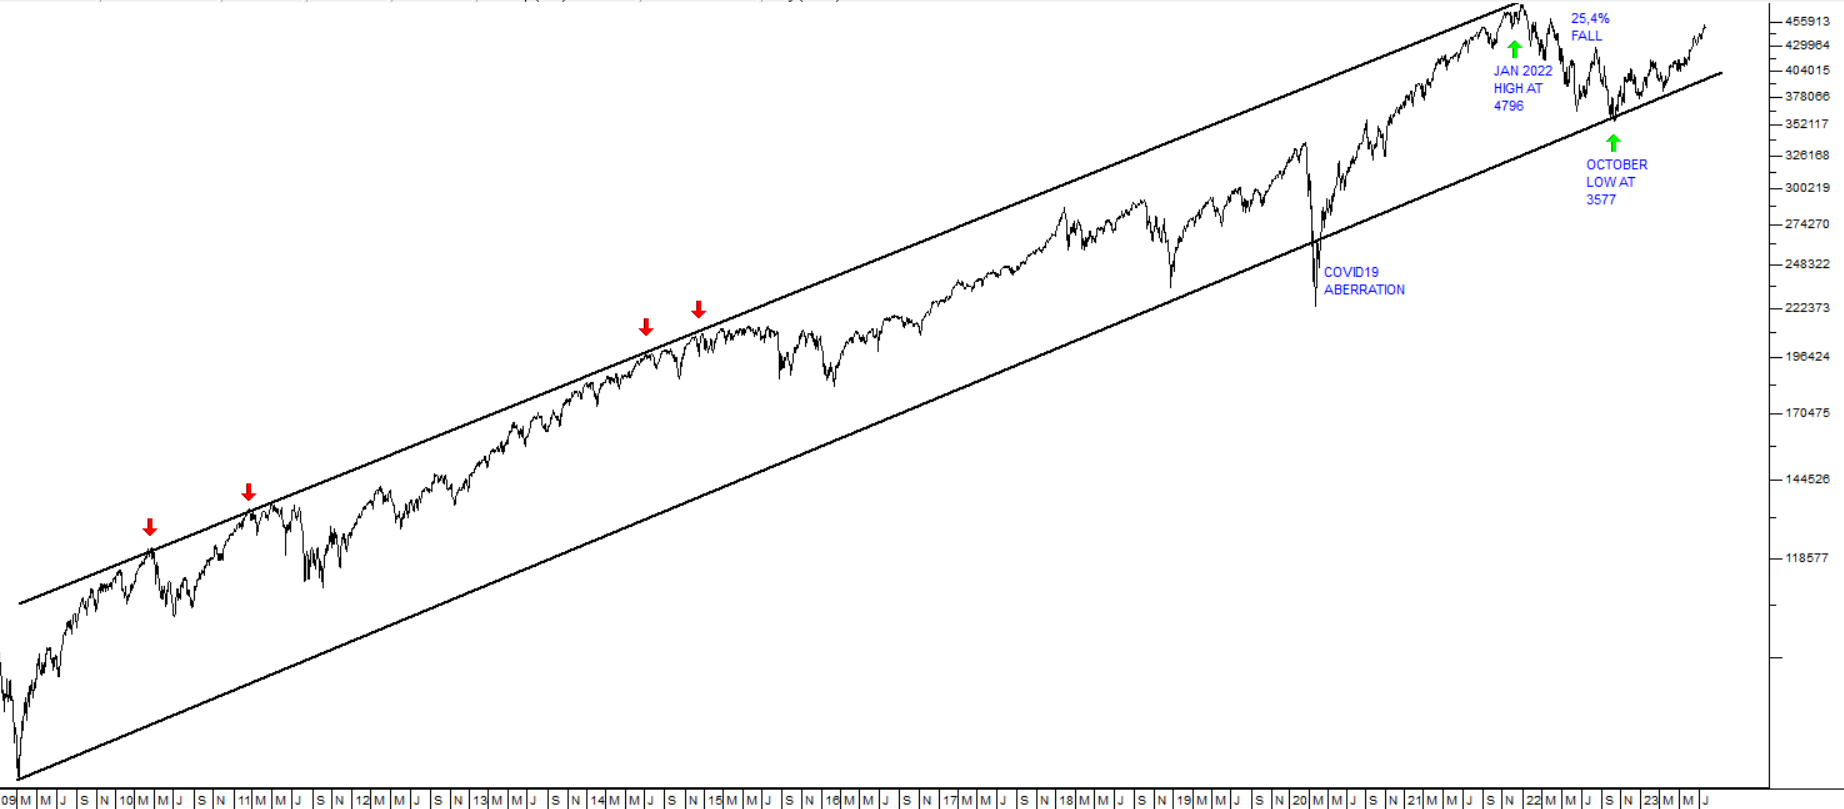
To us it now looks more likely that the 2022 downward trend was an exaggerated and long overdue correction within the larger long-term bull trend which began in March 2009 - rather than a bear trend. To appreciate this suggestion, it is necessary to consider a few points:
- The chart is drawn using a semi-logarithmic scale. Over such a long time period, a linear chart is basically meaningless.
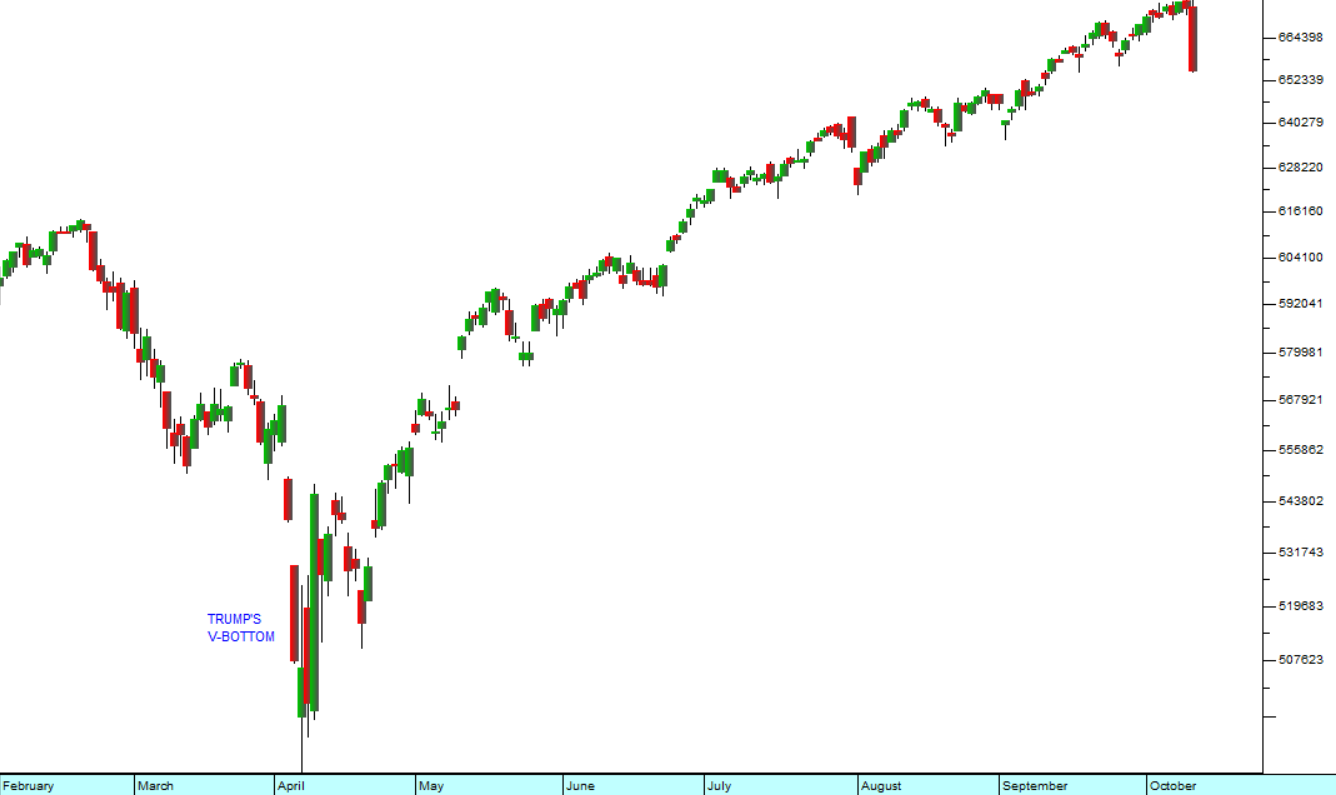
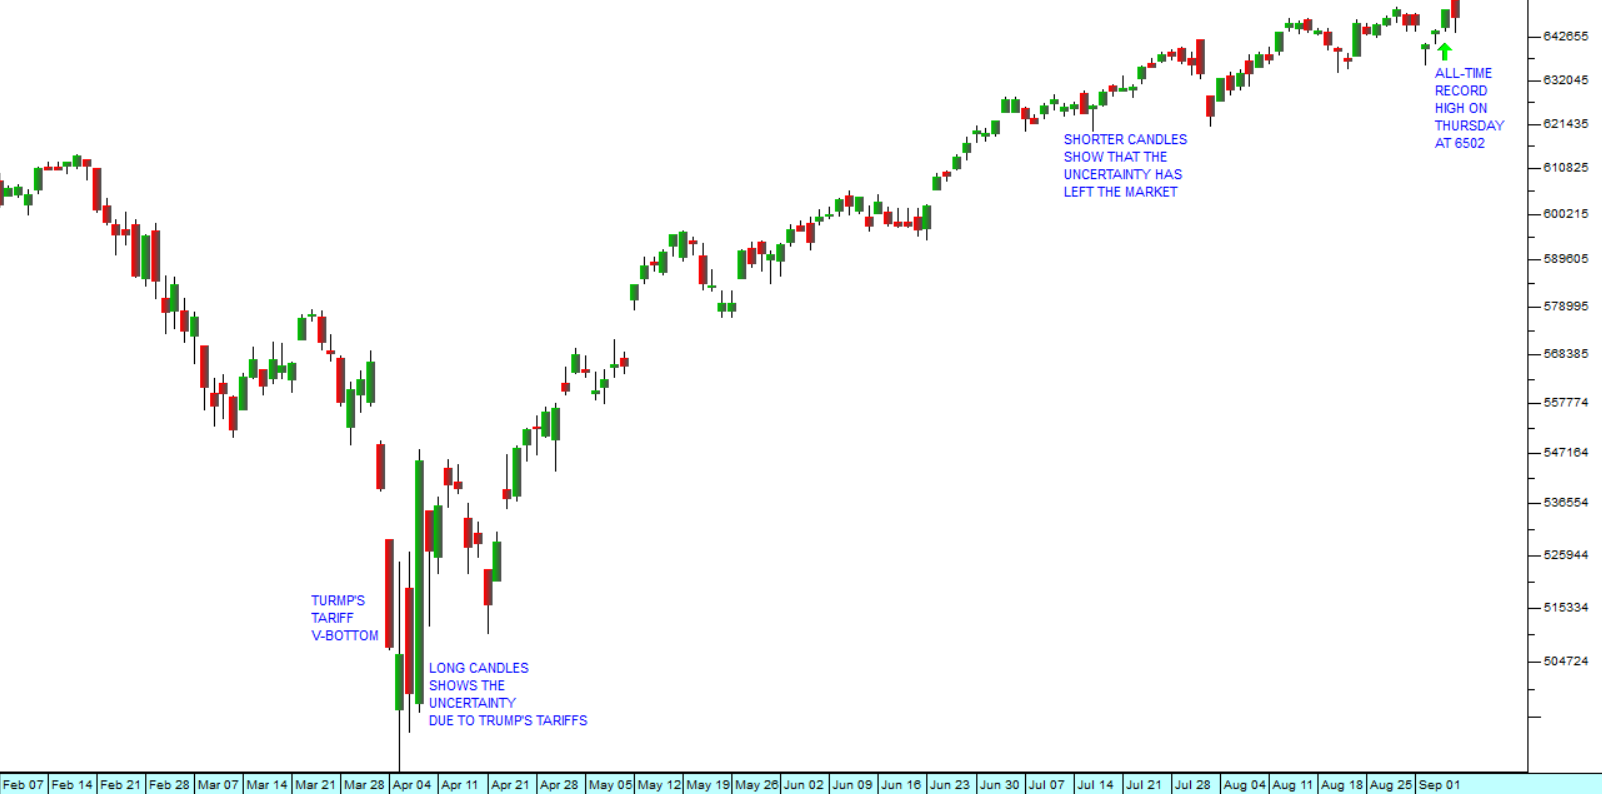
- The 2020 V-bottom associated with COVID-19 was never a proper technical correction. In our view, it was an aberration caused by the completely non-economic “black swan” event of the pandemic. This understanding opens the way for a new interpretation of the current upward trend.
- The two channel lines drawn as they are on the above chart are parallel. To us this is technically very significant.
- The upper channel line is supported by many touch points beginning in 2010, then confirmed in 2011, in both 2014 and 2015 (red arrows) and then, finally, by the all-time high which the S&P made on 3rd January 2022 at 4796.
- The lower channel line is supported only by the initial low made on 9th March 2009 at 676 and now by the cycle low of 3577 made on 12th October 2022. The important point from a technical perspective is that connecting these two “natural” charting points and ignoring the COVID-19 downward spike, gives a lower channel line which is almost exactly parallel to the upper channel line. This is not a coincidence.
If the S&P breaks above its all-time high made on 3rd January 2022, then, to us, it now seems certain that the great bull market which began in 2009 is not yet over, but, after a major correction, is now in its 15th year.
If we are right, the implications for private investors are substantial.
Most importantly, it means that this upward trend represents a buying opportunity. It is well known that most high-quality blue-chip shares trading on the JSE are underpriced – especially when compared to shares elsewhere around the world. What we are suggesting is that it may be time to fill your pockets with them.
If you agree with us, you could do well by looking at the Winning Shares List (WSL) which we have recently started and is available on both the PDSnet web site (www.pdsnet.co.za) and on the Data Center.
Historically, about 70% of the shares added to this list go up and you can use it as a starting point for your share selections.
Right now, nine of the 16 shares added to the list in the last three weeks are up. They are Indluplace (ILU), Old Mutual (OMU), PSG-Konsult (KST), FirstRand (FSR), Reinet (RNI), Remgro (REM), Advanced Health (AVL), Sanlam (SLM) and OUTsurance Group (OUT). And on Friday last week we added Discovery (DSY).
DISCLAIMER
All information and data contained within the PDSnet Articles is for informational purposes only. PDSnet makes no representations as to the accuracy, completeness, suitability, or validity, of any information, and shall not be liable for any errors, omissions, or any losses, injuries, or damages arising from its display or use. Information in the PDSnet Articles are based on the author’s opinion and experience and should not be considered professional financial investment advice. The ideas and strategies should never be used without first assessing your own personal and financial situation, or without consulting a financial professional. Thoughts and opinions will also change from time to time as more information is accumulated. PDSnet reserves the right to delete any comment or opinion for any reason.
Share this article: