Bull Trend?
12 June 2023 By PDSNETArguably, one of the most important, and at times most difficult, questions which a private investor has to answer is:
“Are we in a bull trend or a bear trend?”
It is important because during a bull trend up to 80% of shares will go up and during a bear trend up to 80% will go down – for systematic reasons. In other words, the direction of the market is often far more important than the particular investment merits of the individual shares that you are looking at. Obviously, it is particularly important to consider the profitability of the companies whose shares you intend to buy, but it is often far more important to assess the overall direction of the market.
It is also true to say that, especially in these times of virtually instant electronic communication, the major moves of the markets of the world tend to be similar - and are generally led by Wall Street. So, when the S&P500 index of the five hundred largest companies trading on Wall Street is rising, then you can expect the major indexes of the other stock exchanges around the world (London, Tokyo, Shanghai, and many others including the JSE) to also be rising – and vice versa.
For these reasons, a private investor has to formulate a method by which he or she can decide the overall direction of the market. Various methods are popular, but they all have one thing in common – the more reliable they are, the later they will signal a change in the direction of the primary trend. One method, which we prefer, is to look at the slope of a long-dated moving average. Thus, the 200-day simple moving average (MA) of the S&P500 turned down on Friday 22nd April 2022 when the index closed at 4271.78 – signalling a new bear trend. But historically during the 13 years of the bull trend which lasted from March 2009 until January 2022, the slope of this 200-day MA had turned down giving false signals on five previous occasions.
If we look at the slope of the 300-day MA, it gave only two false signals during that 13-year period, but then it gives its signals of a change of direction about 2 months later than the 200-day MA. So, there is a trade-off between how quickly an indicator gives a signal and how many false signals it gives.
Financial analysts and journalists traditionally regard any move in the primary index (in this case the S&P500) of more than 20% as definitive.
With this in mind, let us consider the situation that exists at the moment.
The S&P500 reached its highest point ever on 3rd January 2022 when it closed at 4796.56. Of course, no one knew for some time afterwards that that was the highest point and that it would go into a bear trend. The ensuing downward move could easily have been just a temporary correction in the bull trend. The bear trend became official on 13th June 2022 when the index closed at 3749.63 – a fall of more than 20% from its peak. The slope of the 200-day simple MA had turned down more than 2 months earlier on 21st April 2022 and the 300-day MA began falling on 3rd June 2022 – 10 days before the official bear trend was announced.
Obviously, no one wants to be invested during a bear trend – and nobody wants to be left out during a major bull trend. But of these two options, being left out of a bull trend is far preferable to being trapped in the market during a bear trend. If you are missing out on the early stages of a bull trend, you are not at risk because you are in cash. If you are caught up in a bear trend, then you are in the unenviable position of losing money every day as you chase the market down.
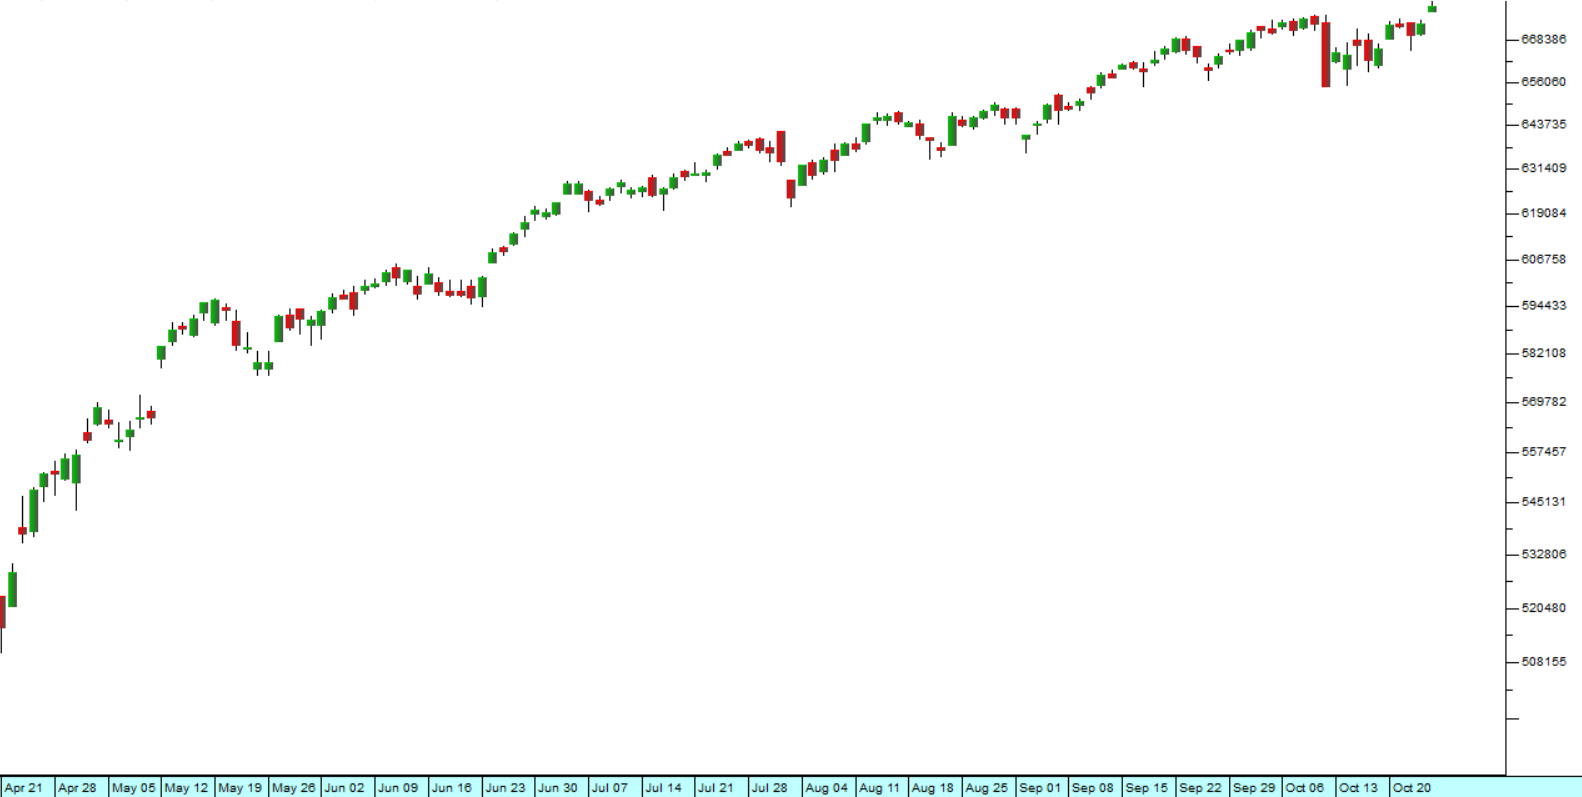
On Thursday last week the S&P500 officially entered a new bull trend because it closed more than 20% above its bear trend low of 3577.03 made on 12th October 2022. The 200-day simple MA had turned up about 10 weeks earlier on 20th March 2023 – and the 300-day MA is still falling. Consider the chart:
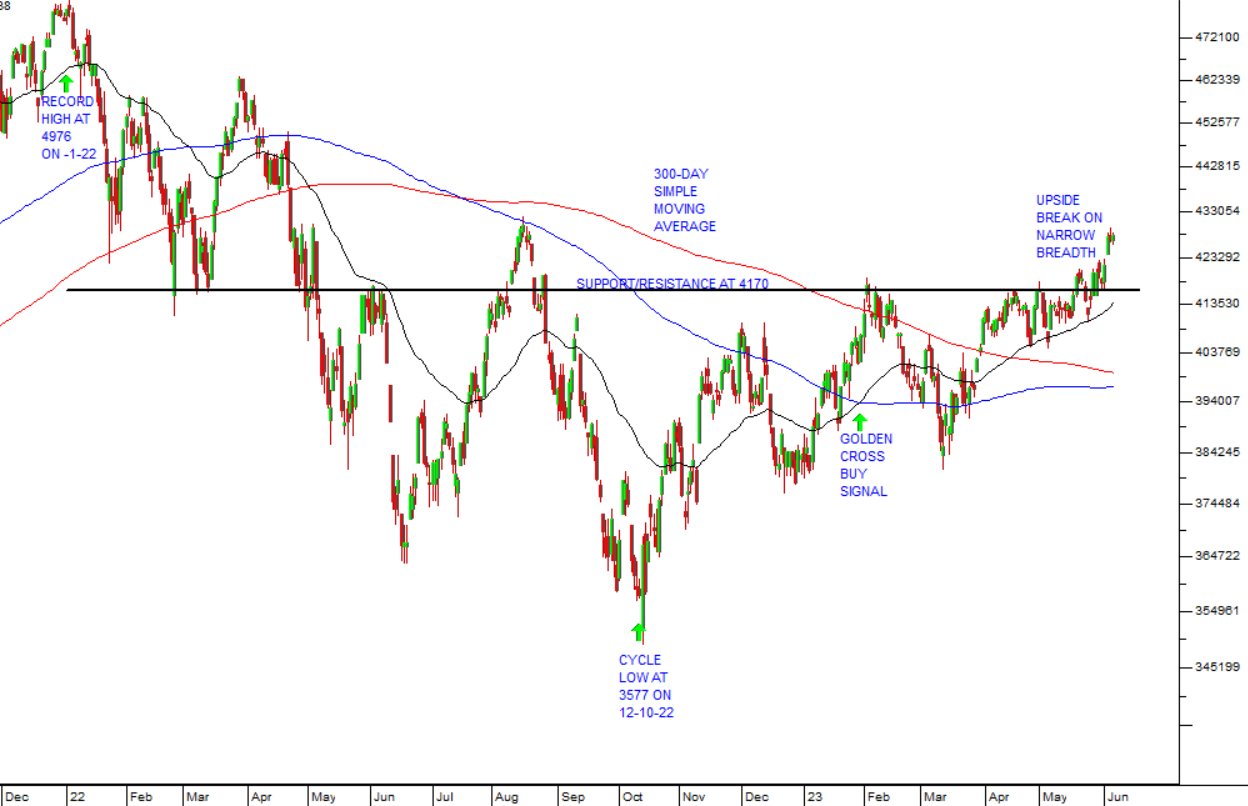
You can see here that after penetrating resistance at 4170, the S&P500 is now testing the previous cycle high at 4305. The 300-day moving average is still falling, but we had a “golden cross” buy signal on 1st February 2023 and the 200-day MA has turned up. Officially, we are back in a bull trend, but the recent upward moves in the S&P have come on very narrow market breadth. See the Confidential Report for June 2023, for more on market breadth.
This is the technical picture, but we think the fundamentals look ominous with the US probably entering a recession later this year and the prospect of further interest rate hikes to bring core inflation down.
So, you have to decide exactly what it is that, for you, will constitute a change in the direction of the trend. We remain bearish, especially considering the negative economic outlook, but there can be no doubt that the charts are now mostly signalling a new upward trend.
DISCLAIMER
All information and data contained within the PDSnet Articles is for informational purposes only. PDSnet makes no representations as to the accuracy, completeness, suitability, or validity, of any information, and shall not be liable for any errors, omissions, or any losses, injuries, or damages arising from its display or use. Information in the PDSnet Articles are based on the author’s opinion and experience and should not be considered professional financial investment advice. The ideas and strategies should never be used without first assessing your own personal and financial situation, or without consulting a financial professional. Thoughts and opinions will also change from time to time as more information is accumulated. PDSnet reserves the right to delete any comment or opinion for any reason.
Share this article: