The Great Bull Resumes
22 January 2024 By PDSNETOn the 12th of June 2023, we published an article, headed "Bull Trend?". In that article we suggested that, after a 25% correction, the great bull market on the S&P500 which began in March 2009 was still intact and would, in time break to a new all-time record high, above the high of 4796.56 made on 3rd January 2022. That happened on Friday last week when the S&P rose an impressive 1,23% to smash its previous record.
In a later article “A New Perspective”, published on the 23rd of July 2023, we explained why we had changed our understanding of the 25% drop in the S&P during 2022 and now regarded it as an exceptionally large correction rather than a bear trend – and that implied that the great bull market was still in progress. The S&P’s strong upward break on Friday clearly confirms that perspective.
Consider the long-term chart of the great bull trend which began on 9th March 2009 from the S&P’s close at 676.53:
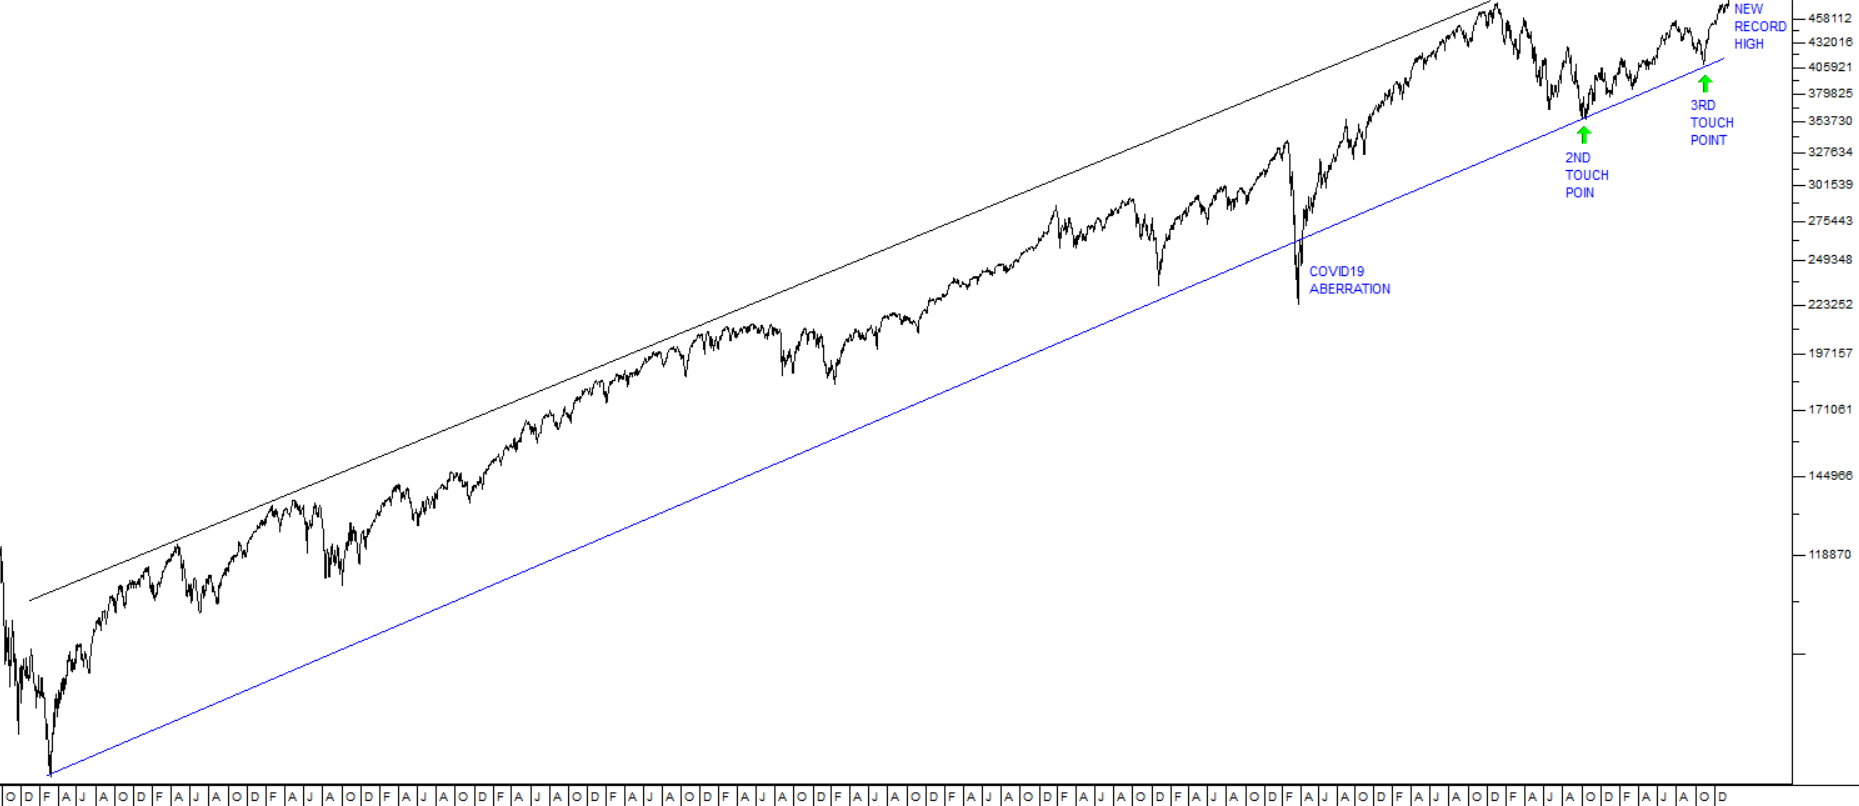
The chart shows the progress of the great bull market over the past fourteen-and-a-half years. It is the longest bull market on record by a long way. As you can see, ignoring the COVID-19 aberration , the trend is bounded by an upper channel line supported by many touch points and a lower channel line which has three touch points, the third of which was the low at 3577 on 12th October 2022.
The significant point about these channel lines is that they are almost exactly parallel, which goes a long way towards establishing their reliability as a technical indicator. After all, what is the probability of them being parallel over such a long period of time?
Now that the previous high made on 3rd January 2022 has been convincingly broken, we can expect the S&P to move up strongly towards the upper channel line. Analysts in America are generally expecting the Federal Reserve Bank’s monetary policy committee (MPC) to begin lowering interest rates at some point during this year – the only argument is whether they will begin in March or sometime later.
Falling interest rates will have a very strong positive impact on the US stock market. Our calculations indicate that the S&P could go as high as 6458 on this leg, probably by some time in 2025 or 2026.
US gross domestic product (GDP) grew by an estimated 2,6% in 2023 and was a massive 4,9% up in the third quarter. That growth is being driven by strong consumer spending and a rebound in manufacturing investment. The impact of artificial intelligence (AI) on productivity is being discounted in the market – especially in high tech shares. Nobody is quite sure about the effect of AI, but almost everyone sees it as very positive.
In our view, the stock markets of the world will continue to climb steadily as new technologies become more pervasive and begin to impact the profits of S&P500 companies. Of course, nothing in the markets moves in a straight line, so you should expect some corrections as the index moves higher. To begin with, the resistance level in the S&P at 4796 will probably now become a support level. In other words, now that that resistance level has been decisively broken to the upside, we should expect the index to retrace back to that level once the current surge is over – but then the great bull trend will resume.
Bottom line: Our view is that you should be substantially invested in this market.
DISCLAIMER
All information and data contained within the PDSnet Articles is for informational purposes only. PDSnet makes no representations as to the accuracy, completeness, suitability, or validity, of any information, and shall not be liable for any errors, omissions, or any losses, injuries, or damages arising from its display or use. Information in the PDSnet Articles are based on the author’s opinion and experience and should not be considered professional financial investment advice. The ideas and strategies should never be used without first assessing your own personal and financial situation, or without consulting a financial professional. Thoughts and opinions will also change from time to time as more information is accumulated. PDSnet reserves the right to delete any comment or opinion for any reason.
Share this article: