Market View
J200 98,385.00 -0.35% J203 106,216.00 -0.33% J210 106,391.00 +1.15% J211 122,776.00 -0.83% J212 24,621.00 -1.20% J213 135,296.00 -1.06%
Winning Shares (Top 5)
Code Name Added Price Latest % Gain % Gain/Year
GLD NEWGOLD 2024-01-18 35895 59220 +64.98% +22.89%
OMU OMUTUAL 2026-10-27 1414 1435 +1.49% +23.57%
SSK STEFSTOCK 2024-06-22 146 694 +375.34% +155.68%
RBO RAINBOW 2025-07-24 417 550 +31.89% +24.10%
PPE PURPLE 2025-04-16 120 176 +46.67% +29.27%
Opinions (Top 5)
Code Name Date Action
RNI REINET 2026-11-20 View

20-11-2026 Reinet (RNI) is an investment holding company whose main asset for many years was a stake in British American Tobacco (BAT). In its financial results for the six months to 30th September 2026 the company reported a net asset value (NAV) or 3626 euro cents per share reflecting an annual growth of 8,2% per annum since 2009.

The company said, "Share buyback programmes: 6 093 269 ordinary shares repurchased during the period for a consideration of EUR 143 million. Commitments totalling EUR 59 million funded during the period. Reinet dividend of EUR 0.435 per share, amounting to some EUR 78 million, paid during the period".

The share, which acts as a rand-hedge due to its euro-denominated assets, fell from a high of R343 in February 2020 to a low of R246 in March 2020 as a result of COVID-19. On 27th May 2026 the share fell heavily on its latest results but remains in a long-term upward trend. Investors should consider the rand’s prospects when evaluating this stock, but we believe it represents good value at current levels.

ART ARGENT 2026-11-20 View

20-11-2026   Argent (ART) is a manufacturer and beneficiator of steel and aluminium products supplying a wide range of businesses in South Africa. It also has operations in the US and the UK. Many of Argent's products are well-known in South Africa such as Xpanda and Jetmaster. It also supplies bulk steel products and beneficiates to suit specific needs.

For example, it sells tube, sheet coil and plate steel. It modifies these products with bending, slitting, and cutting to length. It is the largest distributor for Hulamin and offers a full range of aluminium products. It manufactures ladders, castors, and storage bins. It also produces paint and a range of steel cupboards, desks, filing cabinets and other office furniture.

It manufactures and markets a variety of steel fencing and gates. Most of these businesses are directly impacted by the state of the South African economy so the current conditions have forced the company to restructure substantially. In its results for the six months to 30th September 2026 the company reported revenue up 3,9% and headline earnings per share (HEPS) up 18,9%.

The company's net asset value (NAV) increased 10,4% to 4025,2c per share.  The average daily value traded in this share is over R1,1m, which means that it is viable for private investors. This company is trading on a very low multiple of 8,55 (18-11-26) - which we think makes it good value.

The share has been rising since its low of 1416c on 8th May 2023. We regard this as a good investment at current levels. Obviously, it will benefit directly from any improvement in the economy. 

NTC NETCARE 2026-11-20 View

20-11-2026   The Netcare Group (NTC) operates hospitals and medical response teams throughout South Africa and Lesotho. It has fifty-nine hospitals, four of which are public/private partnerships, employs 22000 people in South Africa and has 10600 beds. Netcare 911 operates from seventy-nine sites and has over 1000 paramedics.

Healthcare is generally not impacted by the business cycle because consumers have to pay for their healthcare, even in a recession, but Netcare says it is being impacted by the competitive nature of medical aids which force them to take lower prices. On 23rd March 2021 Netcare received a letter from the Lesotho government cancelling its contract to run the Queen Mamohato Hospital in Maseru over a wildcat strike by nursing staff.

The vast majority of Netcare’s hospitals have full island capacity, allowing them to operate independently of the grid. In addition, all facilities are supported by Uninterrupted Power Supply (UPS) systems and a fleet of 200 backup diesel generators across the portfolio. In its results for the six months to 31st March 2026 the company reported revenue up 4,8% and headline earnings per share (HEPS) up 21,2%.

The company said, "Sustained focus on operational efficiencies, alongside the continued realisation of the digital dividend, underpinned solid operating leverage of 1.5 times and contributed to a 7.4% growth in operating profit over the prior period". In an operational update for the year to 30th September 2026 the company reported paid patient days up 1,6% and estimated that revenue for the year would increase by 4,2%.

The company said, "For FY 2026, R1 042 million has been applied to repurchase 60.2 million ordinary shares at an average price of 1 724 cents per share". In a trading statement for the year to 30th September 2026 the company estimated that HEPS would increase by between 18,5% and 22,1%.

Technically, the share was in a downward trend since its peak of 4300c in March 2015 until its bottom in March 2020 at around 1200c. A new upward trend began in May 2024 and while volatile appears to be gaining momentum. The share has broken above resistance at 1713c and looks to be entering a new upward trend.

On a P:E of 13,06 (19-11-26) the share looks like a good prospect.

NRP NEPIROCK 2026-11-20 View

20-11-2026   Nepi-Rockcastle (NRP) is a R124bn real estate investment trust (REIT) which operates more than 56 shopping malls in 9 central and eastern European countries, mostly in Poland (24%), Romania (35%), Slovakia (9%), Bulgaria (8%), Croatia (5%) and Hungary (11%). The share fell with the rest of the Resilient group (as a result of the 360ne report in January 2018) from its high of R217 in December 2017 to as low as R99 in November 2018 and then the COVID-19 pandemic took it down to under R55 in March 2020.

Since then it has staged a recovery to around R143.60. The company's total portfolio is worth 6,3bn euros (R124bn) and it ranks as the largest property share on the JSE. On 1st February 2022 the company announced that it had to pay 30m euros in a civil judgement by the Arbitral Tribunal in Poland.

In its results for the six months to 30th June 2026 the company reported income up 3,8% and headline earnings per share (HEPS) up 2,1%. The company said, "The Board has revised the guidance released in February 2026; and based on the good actual and estimated operational results, now expects DEPS for the year to be 3.5-4% higher than the DEPS of 62.03 cents per share in 2025".

In an update for the 9 months to 30th September 2026 the company reported income up 4,2% and like-for-like tenant sales up 3,1%. The company said, "We completed the acquisition of MegaPark Barakaldo in Bilbao, our first investment outside Central and Eastern Europe (CEE). We also finalised the sale of Ozas in Lithuania at a premium to book value, allowing us to redeploy capital into markets with attractive long-term prospects". Technically, the share has recovered convincingly from the pandemic and has been in an upward trend since 1st November 2023.

We still regard it as good value at current levels and expect the upward trend to continue. 

SLM SANLAM 2026-11-20 View

20-11-2026 Sanlam (SLM) is one of the largest insurance and financial services groups in South Africa. It was established in 1918 and demutualised in 1998 and then listed on the JSE and the Namibian Stock Exchange. It has operations in South Africa, the UK, America, Europe, India, and Australia as well as a range of other African countries.

Its product range includes general insurance, life insurance, asset management, banking, credit, health and bancassurance. The business has four essential elements: 1. Sanlam Investment Holdings (SIH) - now 25% owned by African Rainbow Capital 2. Sanlam Emerging markets - which includes its 84,5% interest in Saham 3.

Sanlam Personal Finance 4. Santam - in which it owns 61% Outside of South Africa, it has operations in 11 other African countries and Malaysia. Saham has operations in 33 French-speaking countries with 3000 staff members operating out of 700 branches offering a similar product mix to Sanlam.

Sanlam also owns 26% of Shriram which is a leading provider of insurance products and financial services in India. It also made a deal to acquire 69% of Catalyst Fund Managers, a Cape-based manager of listed property assets and 100% of an Irish company, CIG Fund Management. About 50% of Sanlam's profits come from its personal finance operation which is primarily based inside South Africa.

It is therefore impacted by the low levels of consumer spending in this country as well as the economic recession. Sanlam is 18% black-owned and has initiated a partnership with African Rainbow Capital (ARC) in which it intends to focus on lower- and middle-income consumers and small companies.

Sanlam will provide R2bn of seed capital. In its results for the six months to 30th June the company reported headline earnings per share (HEPS) down 16% and core earnings up 1%. The company said, "...earnings were negatively impacted by elevated weather-related general insurance claims across South Africa and parts of Africa, as well as rand strength, which reduced the translated value of earnings from businesses outside South Africa".

In an update on the 9 months to 30th September 2026 the company reported new business volumes up 20% and core earnings 1% up. The company said, "The result was adjusted up by 5% for comparability, mainly reflecting the impact of a stronger rand (3,5%) and changes to the group structure, including the sale of the South African active asset management business to Ninety One".

Sanlam is one of the JSE's foremost blue-chip shares with a history of steady growth over a long period of time. After recovering somewhat from the fall in markets due to Trump's tariffs it is currently trading on a P:E of 10,58 (19-11-26). We consider it to be good value at these levels. 

Winning Share: RBO
Opinion: SLM
Nvidia  (2026-11-16)

Charismatic leadership in business can often be a major problem. When a company is dominated by a single individual who then becomes incapacitated for some reason, the result is normally a sharp downward re-rating of the share. Charismatic leadership can increases the key-person risk for an…

Charismatic leadership in business can often be a major problem. When a company is dominated by a single individual who then becomes incapacitated for some reason, the result is normally a sharp downward re-rating of the share. Charismatic leadership can increases the key-person risk for an investor.

In the current case of Nvidia, the CEO, Jensen Huang, has now resigned following a series of scandals regarding his extra-marital affairs and their possible link to Chinese spying. The impact on the share price over the past month has been substantial. On 6th October 2026 Nvidia shares closed at $241,90 and on Friday last week they closed at $162,83 – that is a drop of almost one third and wiped $1,85 trillion off its market capitalisation. Consider the chart:
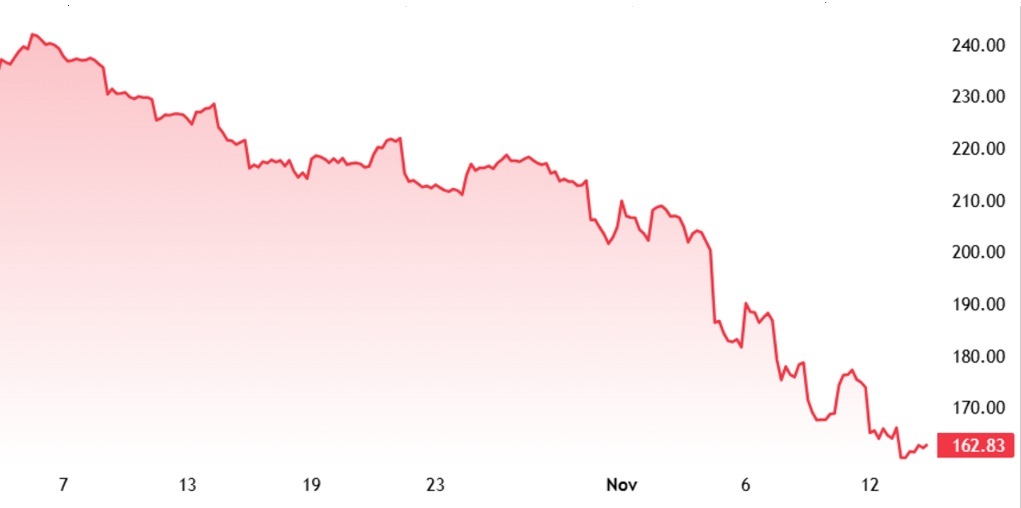
Nvidia : 7th of November 2026 - 13th of November 2026. Source: https://www.tradingview.com/symbols/NASDAQ-NVDA/?timeframe=3M


Huang was the co-founder of Nvidia in 1993 and had served as its President for 33 years. After early struggles, the company broke through with chips like the RIVA 128 and went public in 1999, the same year it introduced the GeForce 256—the world's first graphics processing unit (GPU). This led to the bold bet to launch CUDA, a parallel computing platform that allowed GPUs to handle general-purpose computing—laying the foundational software architecture for modern deep learning and artificial intelligence (AI). This scaled Nvidia into the backbone of the global AI and data centre revolution, driving the company to a multi-trillion-dollar valuation and transforming it into one of the most influential technology companies in history.

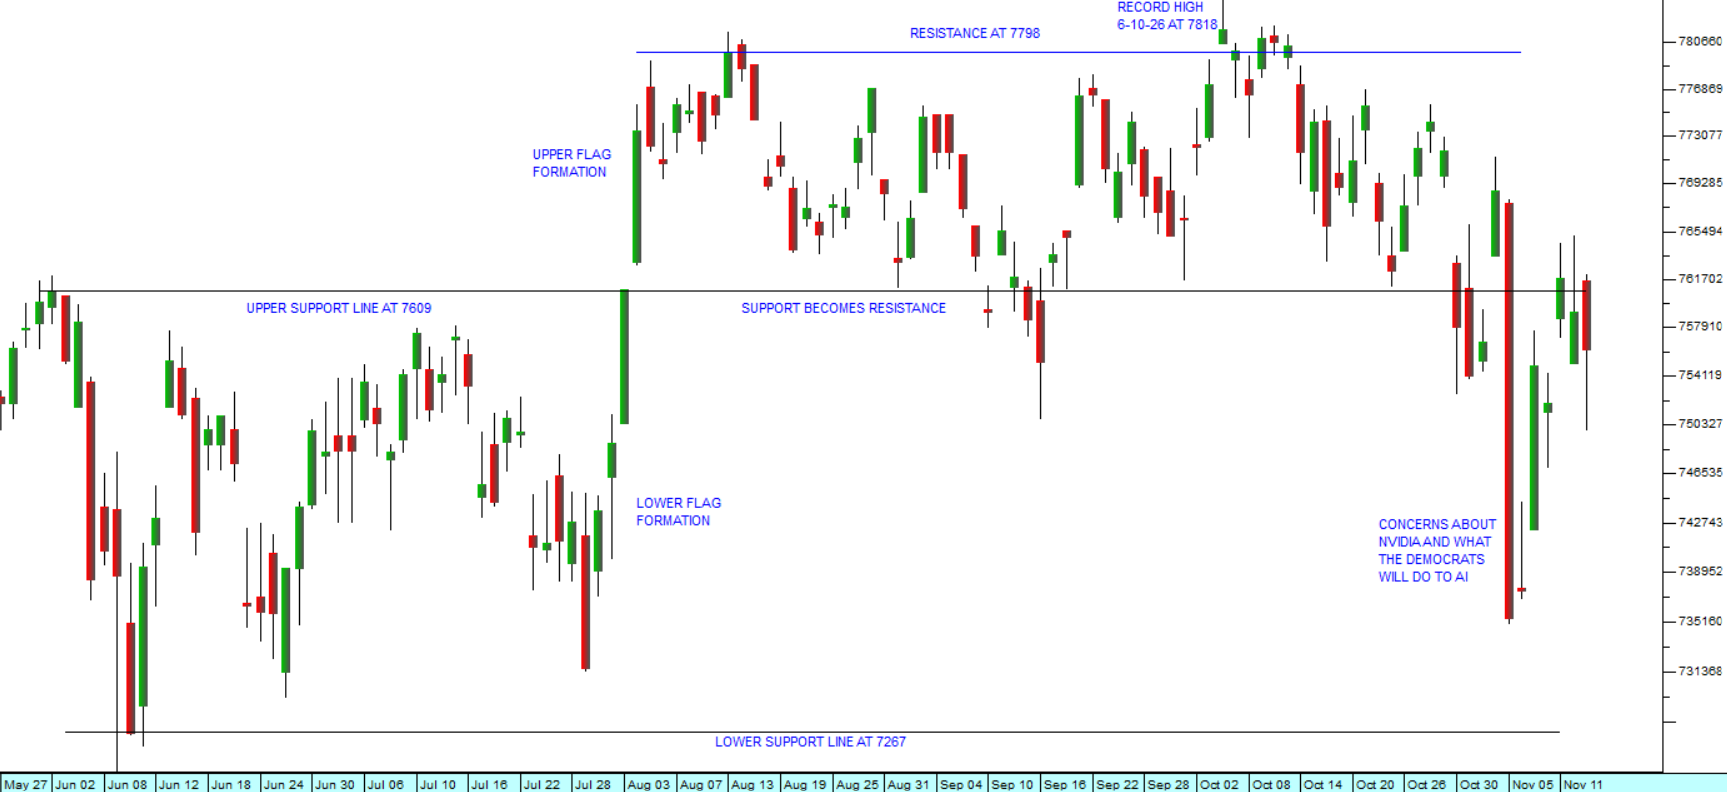
Clearly, Huang was an important person and his leadership on the Nvidia board was crucial – so when rumours began circulating of his relationship problems and the possible connection to China, investors began selling the stock as concerns about leadership uncertainty increased. What is interesting is that the sharp decline in the price of Nvidia has not dragged the other shares in the Magnificent 7 down with it, and while it was the main contributor to a correction in the S&P500, it has not precipitated a major collapse. The S&P500 also reached an all-time record high on 6th October 2026 closing at 7818, but it was only down by 3,3% from that record high at Friday’s close. Consider the chart:

S&P500 Index :  27th of May 2026 - 13th Of November 2026. Chart by ShareFriend Pro.

The chart shows that developments at Nvidia combined with concerns around what the Democrats might do to curtail the growth of AI took the S&P500 down but did not penetrate the lower support line at 7267. In our view, AI has its own momentum and is now stimulating growth in most companies across America and the world. The Democrat victory in the mid-term elections is unlikely to derail that. One major positive impact of the election was that it immediately brought the price of North Sea Brent down to $95.

In our view, the Democrat win also brings another major positive – it signals the end of the MAGA/Trump era with all the uncertainty that that entailed. Notably the JSE Overall index has actually been going up since 6th October 2026 showing that local investors never really believed that Wall Street was in a major correction. We are expecting further declines in the price of oil and fewer disruptive shocks from the Trump administration going forward.  
Democrat Sweep  (2026-11-09)

It seems fair to say that while most analysts and investors expected the Democrats to do well in the US mid-term elections, most were also caught completely off-guard by the extraordinary extent and depth of that win - and this has resulted in a burst of increased volatility in the markets as they…

It seems fair to say that while most analysts and investors expected the Democrats to do well in the US mid-term elections, most were also caught completely off-guard by the extraordinary extent and depth of that win - and this has resulted in a burst of increased volatility in the markets as they adjust to the new reality. Trump’s decision to appoint Stephen Miller as his Chief of Staff shows that he has no intention of moderating his position by working with the Democrats – instead he is doubling down on the extreme right-wing politics which has made him so unpopular.

The initial reaction to the vote was undoubtedly one of relief and euphoria as the Democrats claimed first the House and then the Senate. Then the next day that excitement gave way to fear that they might use their now overwhelming power to somehow curtail or limit AI and the build out of data centres across America.

This led, the next day, to a massive 4,4% drop in the S&P500, completely wiping out the gains of the previous day and taking the NASDAQ particularly, down sharply. Voters and newly elected officials have already passed dozens of local measures restricting data centres (from outright bans to temporary moratoriums), while incoming governors in states like Texas and Georgia have signalled plans to pause or heavily regulate new construction.

Hyperscalers and data centre operators have been funding massive expansions with heavy borrowing and private credit. Rising AI credit costs and heavy debt loads have sparked fears among investors of financial strain, stranded assets, or potential defaults if demand falls short. What if the direction of the technology changes and these huge investments are suddenly irrelevant and there is an unsupportable overhang of debt and abandoned assets?

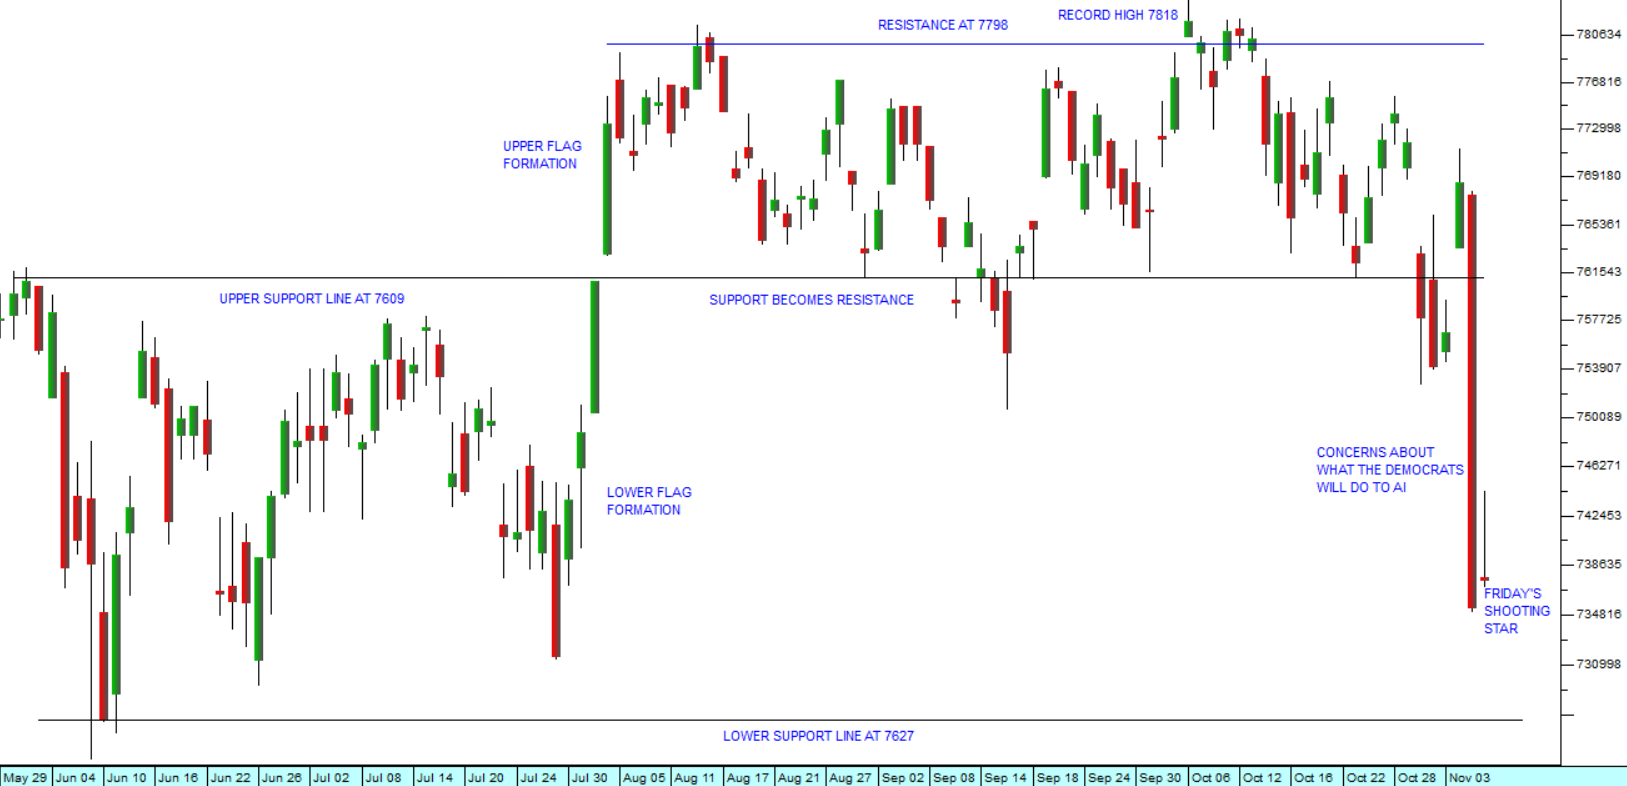
Those fears, added to the fact that tech shares were very already high and due for some kind of correction, has led to a rapid rotation out of AI and into other sectors or into cash. Consider the chart:

S&P500 Index : 29th of May 2026 - 6th of November 2026. Chart by ShareFriend Pro.

Of course, the Anthropic IPO is due to happen on 19th November 2026 and their prospectus has already been issued. They are looking to raise between $80bn and $100bn off a market valuation of between $1,5tr to $2tr. That will now almost certainly have to be curtailed – possibly to as little as $1tr. While Anthropic showed explosive growth - posting $16.3 billion in revenue for the first half of 2026 (up 1,300% year-over-year) - it also recorded an $80.7 billion net loss during that same period.

As a private investor on the JSE watching all this unfold on world markets and with our own election results in the background, you must obviously ask how these things will impact on emerging markets and on South Africa in particular. Our markets, and especially the rand have remained remarkably stable throughout the turbulence. The rand weakened, as far as R16,75 to the US$ and strengthened as far as R16,35, and now has settled in the middle ground of R16,51. This shows that the sharp downward move on Wall Street has not resulted in a huge shift towards risk-off among international investors. The smart money is still buying South African high-yield bonds and our relatively cheap high-quality equities.

On Friday, the US markets stabilised with many investors buying the dip and other even going as far as selling put options for a quick gain if the market recovers some of its former balance. However, the  shooting star formation does not bode well for the coming week. From a purely technical perspective, the lower support line on the S&P at 7626 now becomes important. If that is broken then we are in a full-blown correction.

Against this, we look at the underlying fundamentals of the third quarter S&P500 company earnings and feel that, at the very least, the Thursday sell-off was over-done. At this time 88,2% of S&P500 companies have reported and 82% of those have beaten earnings projections while 74,6% beat revenue expectations. This shows that the bull trend has been very well supported by rising profits across the board. In other words, it does not have the look of a bubble in the throes of bursting. But, in these turbulent times, your ultimate protection remains your stop-loss strategy.

Sasol and the Rising Oil Price  (2026-10-26)

Every major event that happens in the world inevitably offers some kind of investment opportunity for the private investor. The challenge is to work out how best to capitalise on it. So, it was with the war in Iran. At the time that the war began with the Israeli and American bombing raids on 28th…

Every major event that happens in the world inevitably offers some kind of investment opportunity for the private investor. The challenge is to work out how best to capitalise on it. So, it was with the war in Iran.

At the time that the war began with the Israeli and American bombing raids on 28th February 2026, we had already been watching the progress of Sasol for some time. The situation in Iran was tense with riots reported and North Sea Brent had climbed back up to $70 per barrel, but we had no idea that the Americans and Israelis were about to launch a bombing attack.

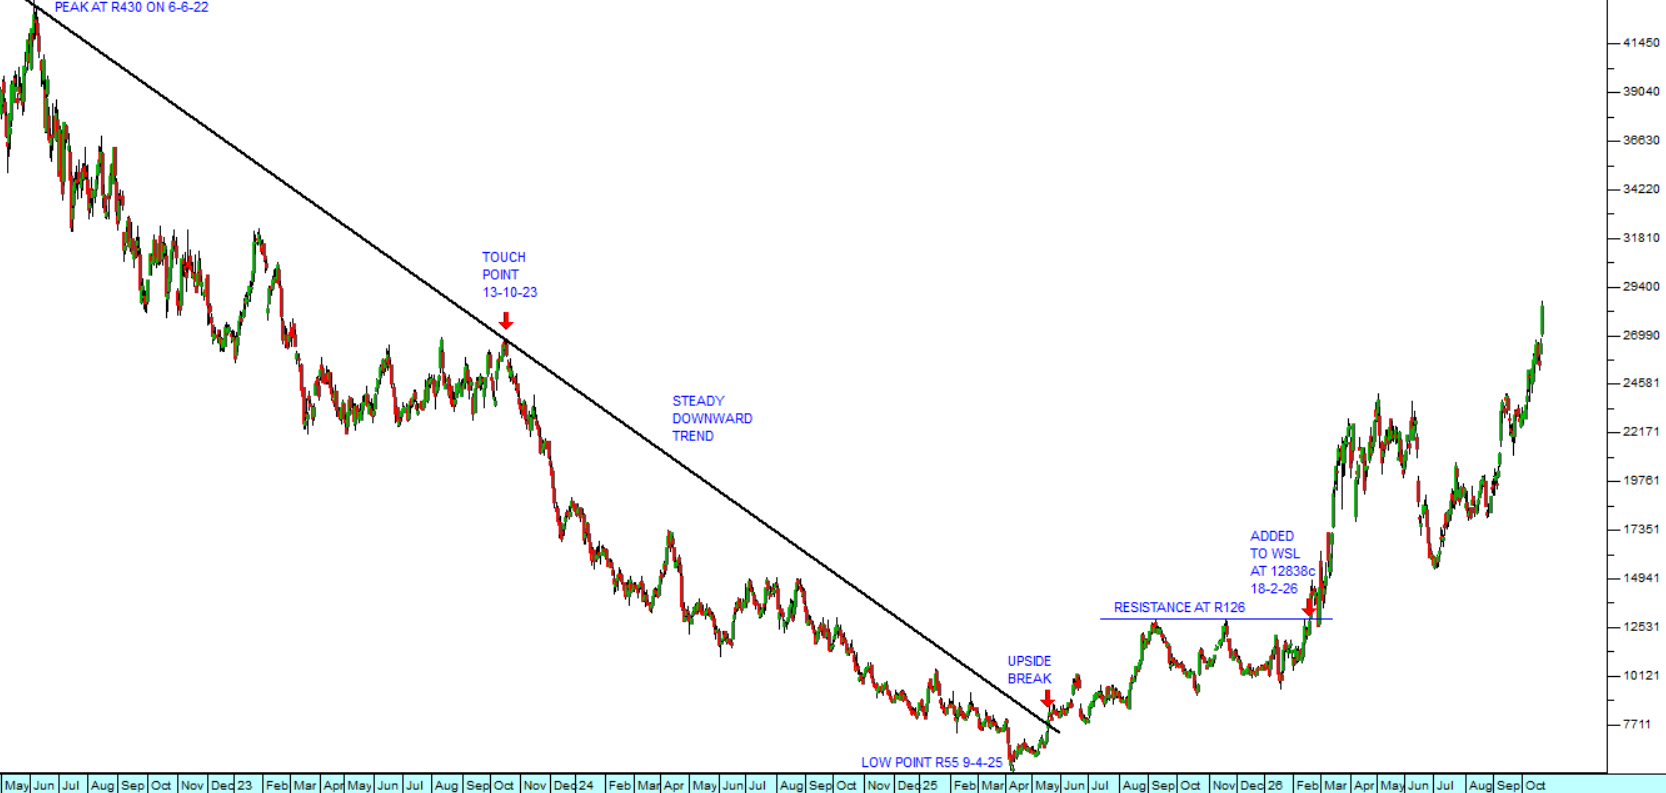
Sasol was always a blue-chip share and has historically occupied a dominant position in South Africa's synthetic fuels industry. It had, however been through some difficult times and the share price had fallen from a high of R430 per share to as low as R55 in April 2025. It then went through an extended period of sideways consolidation. We finally decided to add it to the Winning Shares List (WSL) on 18th February 2026 at a price of R128.36. Technically the share broke above resistance at R126 indicating that something was afoot. Consider the chart:

Sasol (SOL) : May 2022 - 23rd of October 2026. Chart by ShareFriend Pro.

The chart shows Sasol’s long downward trend that began in the middle of 2022, mainly because of the falling price of various grades of oil. North Sea Brent oil fell from a high of $125 per barrel on 8th March 2022 to its cycle low just below $60 per barrel in mid-December 2025. Since Sasol derives more than half of its revenues and profits from the fuel industry, it is directly linked to the price of oil.

Sasol had been recovering but had encountered significant resistance at R126 per share. When it broke decisively above that level, that gave us the signal we needed. Immediately prior to the start of the war the oil price had been climbing, and in January 2026 there were riots in Iran which Trump and Netanyahu used as a pretext to begin the bombing. The price of Brent rose above $70 per barrel on 18th February, before the bombing started, and that triggered a rise in Sasol’s share price. We decided then that Sasol was probably under-valued and due for an upside move.

Sasol’s latest results for the year to 30th June 2026 show the benefits of the rising price of oil. Turnover was up 9% and earnings before interest taxation depreciation and amortisation (EBITDA) was up 17% while the company reduced its debt by 11%.

We do not normally advise investors to buy commodity shares like Sasol because they are riskier, but sometimes they can offer very good capital gains. In the case of Sasol the share appreciated rapidly after we added it to the WSL and then there was a correction as the oil price temporarily fell back in June and July this year. We held on because we thought there might be further upside potential.

The best investment policy is to try to hold onto your shares for at least three years, unless you are moving into a loss position (i.e. you had to execute an early stop-loss sale). This is because if you hold them for less than 3 years the Receiver may seek to declare you to be a share dealer – and then any gain you make will be added to your taxable income and you will be taxed on it at your marginal rate. If you hold for longer than 3 years, then your appreciation is treated as a capital gain for tax purposes and taxed at 18%.

As it turns out holding on to Sasol was the right decision and the share has now appreciated by 134% in about 8 months since we added it to the WSL – which is just shy of 200% per annum.

JSE Top 40

98,385.00 (-0.35%)

All Share

106,216.00 (-0.33%)

Financial 15

24,621.00 (-1.20%)

J200
J203
J212
Top Gainers
# Code Name Close (c) % move
1 CKS CROOKES 2350 +17.50%
2 WEZ WESIZWE 42 +16.67%
3 JBL JUBILEE 32 +10.34%
Top Losers
# Code Name Close (c) % move
1 ISO ASPI 2187 -12.34%
2 EMN E-MEDIA-N 160 -8.57%
3 PHP PHP 2001 -8.38%

Top Movers – Charts

Top Gainer: CKS
Top Loser: ISO