S&P Touches Record High
22 August 2018 By PDSNETOn the 9th of July 2018 and previously on the 6th of April 2018 we suggested in articles that the S&P had reached the bottom of its correction at 2581 and found strong support at the level. We also suggested that the strength of that support indicated that the correction had probably found its lowest point (2581) and would move up to break its all-time record high at 2872. Now the chart of this correction looks like this:
The 4th Correction
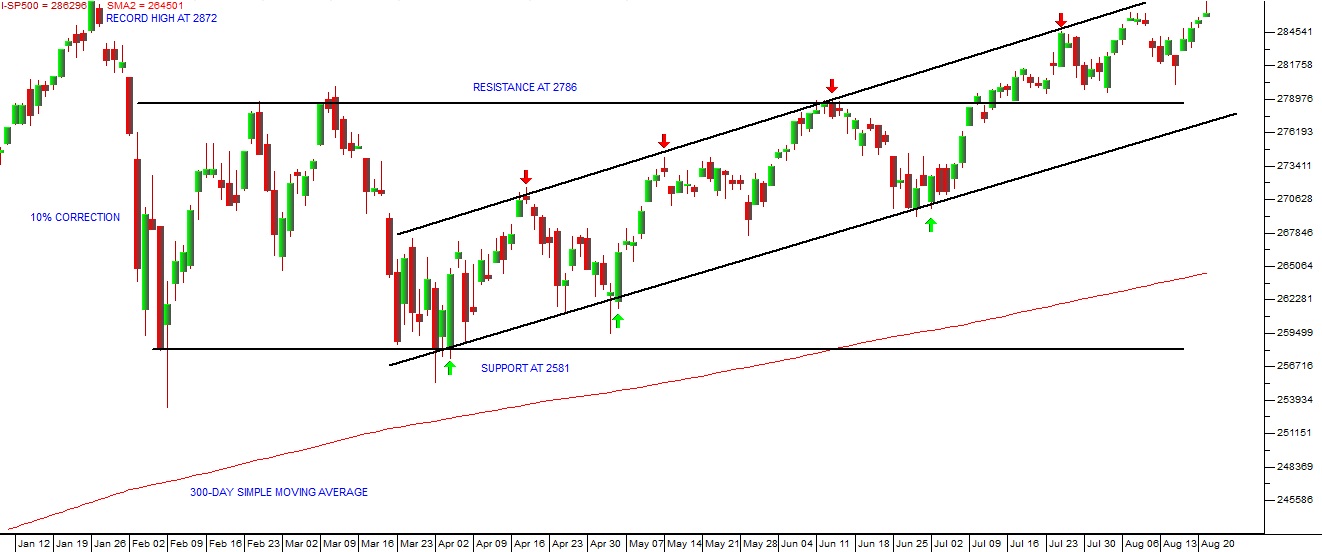
S&P500 Index January 2018 to August 2018 - Chart by ShareFriend Pro (Click to Enlarge Image)
The upward sloping channel which began at the beginning of April 2018 has proved to be reliable and, as we have previously suggested, is having the effect of taking the S&P back up towards its all-time record high of 2872 made on 26-1-2018. Last night it actually touched that record level before falling back to close 20 points lower at 2862. This is typical of a previous high. There will always be some resistance at the level of a previous high. The bears will attempt to create a “double top”. However, in our opinion, it is highly likely that the S&P will break to a new record high in the next few trading days. Once a new record high is reached and the index closes convincingly above that level, the correction, which has lasted almost seven months, will end. This will signal a resumption of the great 9-year-old bull trend that began in March 2009. Consider the chart:The Great Bull Trend
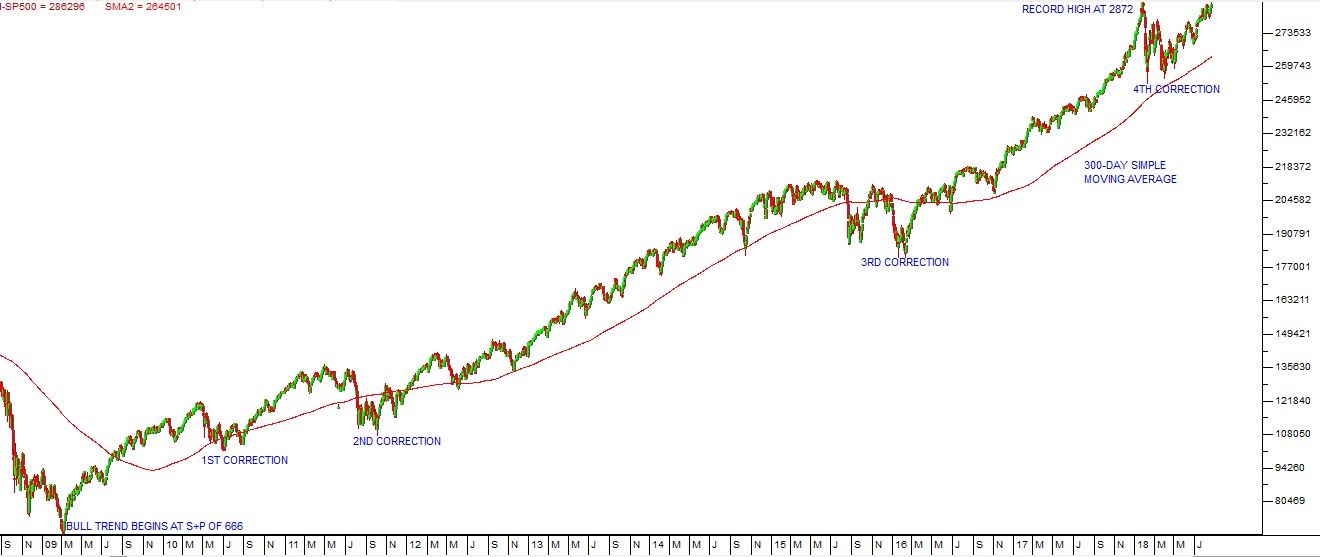
S&P500 Index September 2008 to August 2018 - Chart by ShareFriend Pro (Click to Enlarge Image)
Some analysts have suggested that this bull trend is nearing its end – simply because it has been around for so long. Our view is that it is only just getting going, because it is based on the massive, unprecedented and world-wide monetary policy stimulation that followed the 2008 sub-prime crisis. All that money that was printed and injected into the world economy is still sloshing around out there looking for a home. Now, among other things, it is causing the US economy to generate 210 000 new jobs on average every month. That growth, inevitably, is being reflected in the S&P500, pushing it to new record highs. The JSE will follow it up – so, as a private investor you should be looking at high quality shares like Dischem, Capitec and the Resilient group which have been pushed down excessively during the correction.DISCLAIMER
All information and data contained within the PDSnet Articles is for informational purposes only. PDSnet makes no representations as to the accuracy, completeness, suitability, or validity, of any information, and shall not be liable for any errors, omissions, or any losses, injuries, or damages arising from its display or use. Information in the PDSnet Articles are based on the author’s opinion and experience and should not be considered professional financial investment advice. The ideas and strategies should never be used without first assessing your own personal and financial situation, or without consulting a financial professional. Thoughts and opinions will also change from time to time as more information is accumulated. PDSnet reserves the right to delete any comment or opinion for any reason.
Share this article:
