The Bitcoin Bubble
Over the past few years the emergence of cryptocurrencies, and particularly, Bitcoin has attracted much media comment and speculation. Your software includes a chart of the US dollar price of Bitcoin since 2010. It is like no other chart you have ever seen mainly because it is not a share or even a derivative. Many of our clients ask us whether they should be investing in Bitcoin and our answer is: "Probably not". This answer is based on our normal approach to any investment and that is to consider what the true value of the underlying asset is - and then compare that with the price that it is trading for in the market.
Thus, a share represents a part-ownership of a company and you can examine the company, consider its potential for generating profits and dividends in the future. This will give you an idea of how much you should be paying for it now. Shares oscillate from being over-priced to being under-priced in relation to the dividend-generating potential of the underlying company. However there is no asset to back your Bitcoin (or any of the other 800 cryptocurrencies now in circulation) and so you cannot consider the fundamental value of what you are buying. You are only buying it because somebody else might buy it back from you in the future for a higher price. This is the stuff that bubbles are made of. Historically the first recorded market bubble was the market for tulip bulbs in Denmark in 1630 (the so-called "tulip mania"). Here the asset was rare and valuable tulip bulbs that could produce exotic blooms. The public got involved in this bubble and many people invested their entire life savings. The price of bulbs sky-rocketed, only to then collapse, bankrupting most investors. The key here is that a market becomes dangerous when it goes up exponentially and when everyone (even people who know absolutely nothing about it) get involved. That is exactly what is happening with the Bitcoin market. Consider the chart of Bitcoin since January 2015: 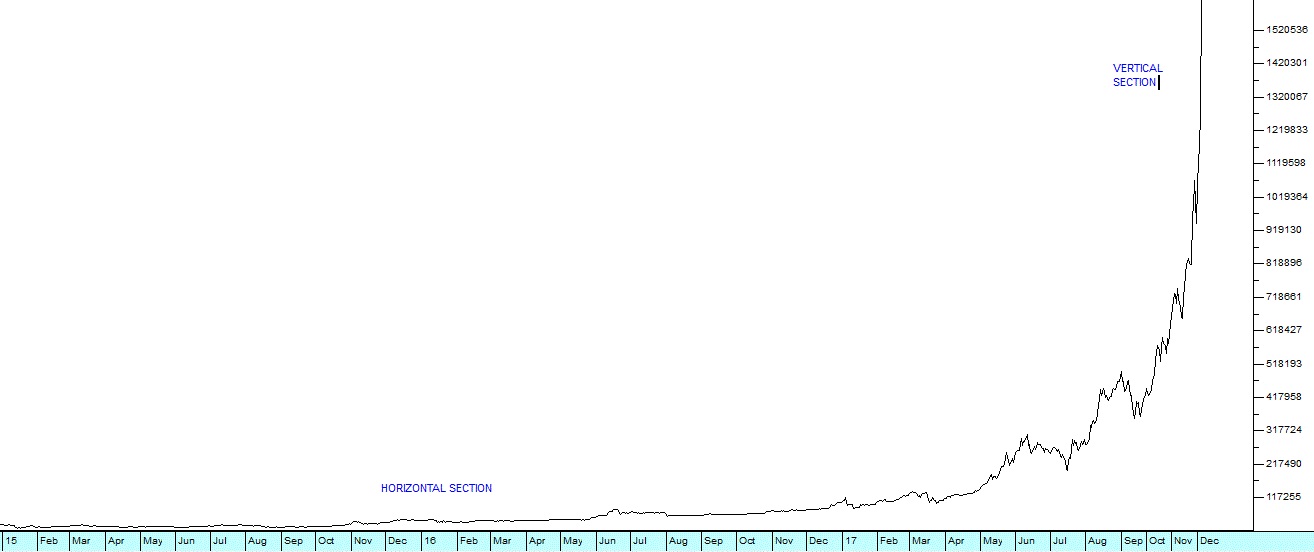
Bitcoin Spot Price US Dollar - Chart by ShareFriend Pro
Charts like this simply do not exist in the financial markets not even in derivatives or even currencies. This is an absolutely classical exponential chart. As the idea of Bitcoin catches on world-wide everyone wants to get involved and that is pushing up prices to ridiculous levels. Thus, on Monday this week (4th December 2017) a Bitcoin could be bought for $1130. On Tuesday it closed at $1170, on Wednesday it reached $1276 and on Thursday $1620! Clearly, this rise in prices cannot be sustained. And when it falls it will probably fall very quickly as millions of novices suddenly get scared and panic. The people who make money from bubbles (as with pyramid schemes) are those who get in early and then get out while demand is still strong. Our advice: If you don't have Bitcoins, stay well clear. If you have them sell while the going is good.
← Back to Articles