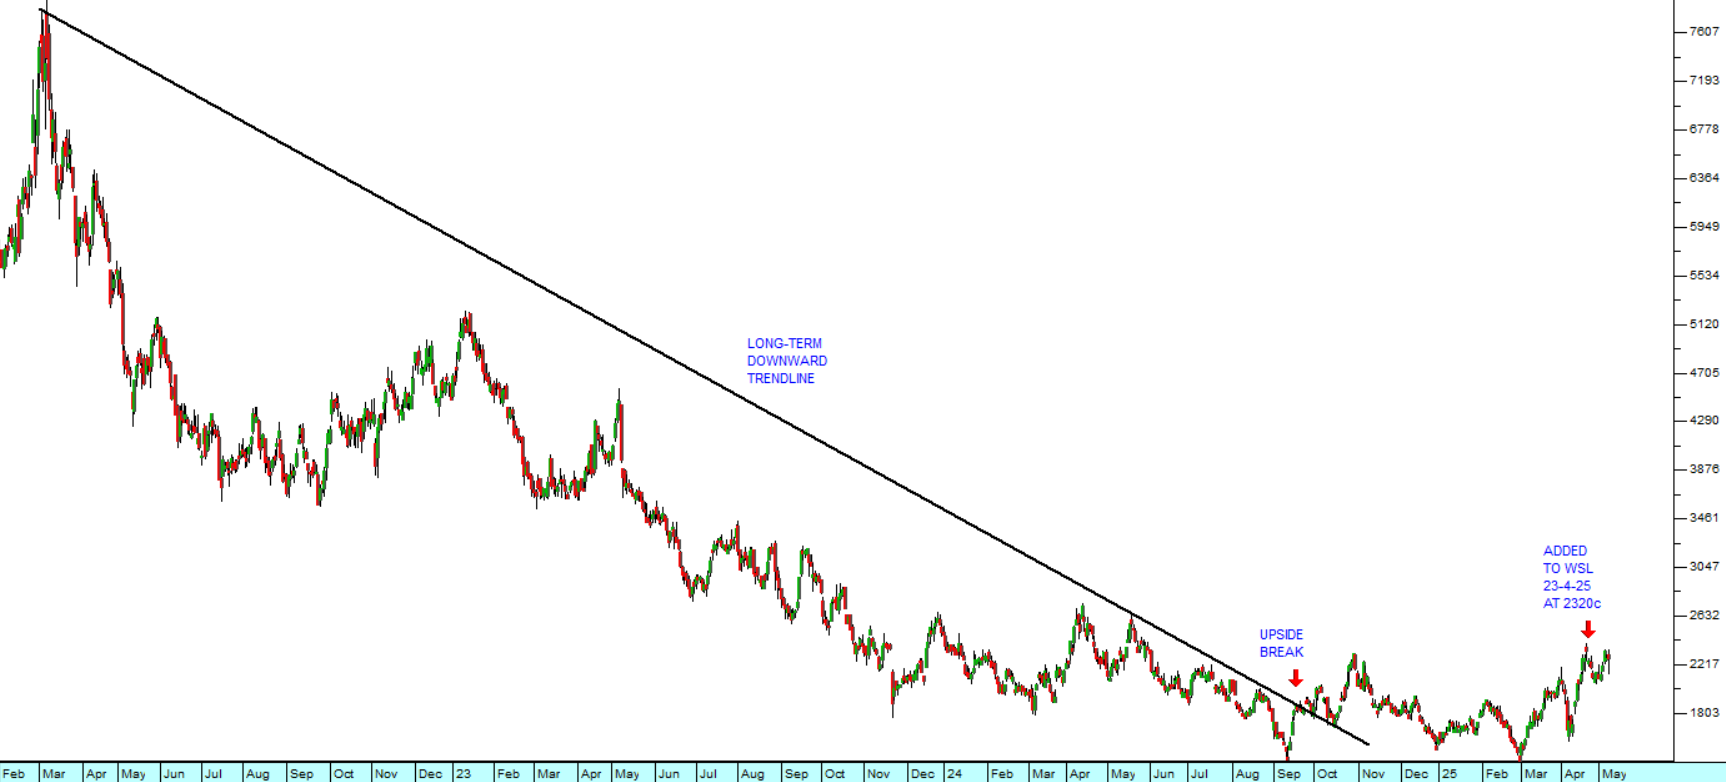
The S&P500 Revisited
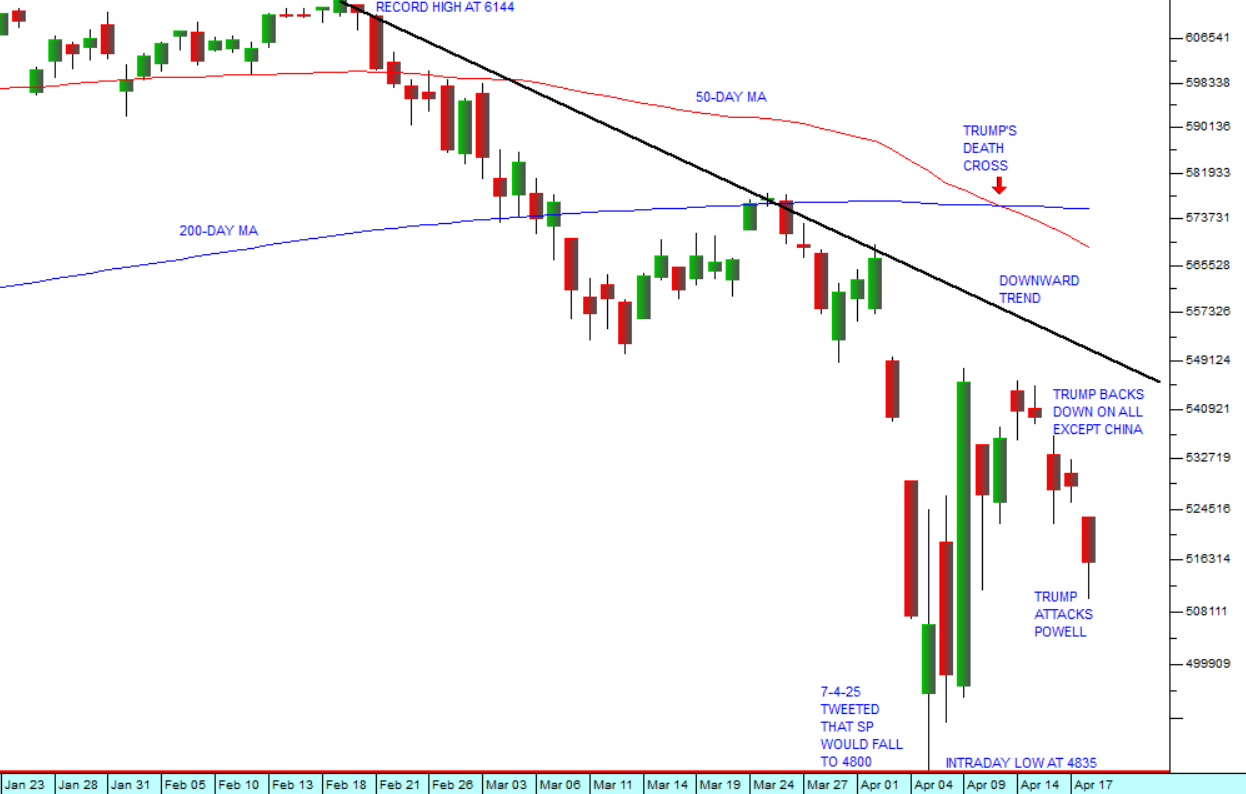
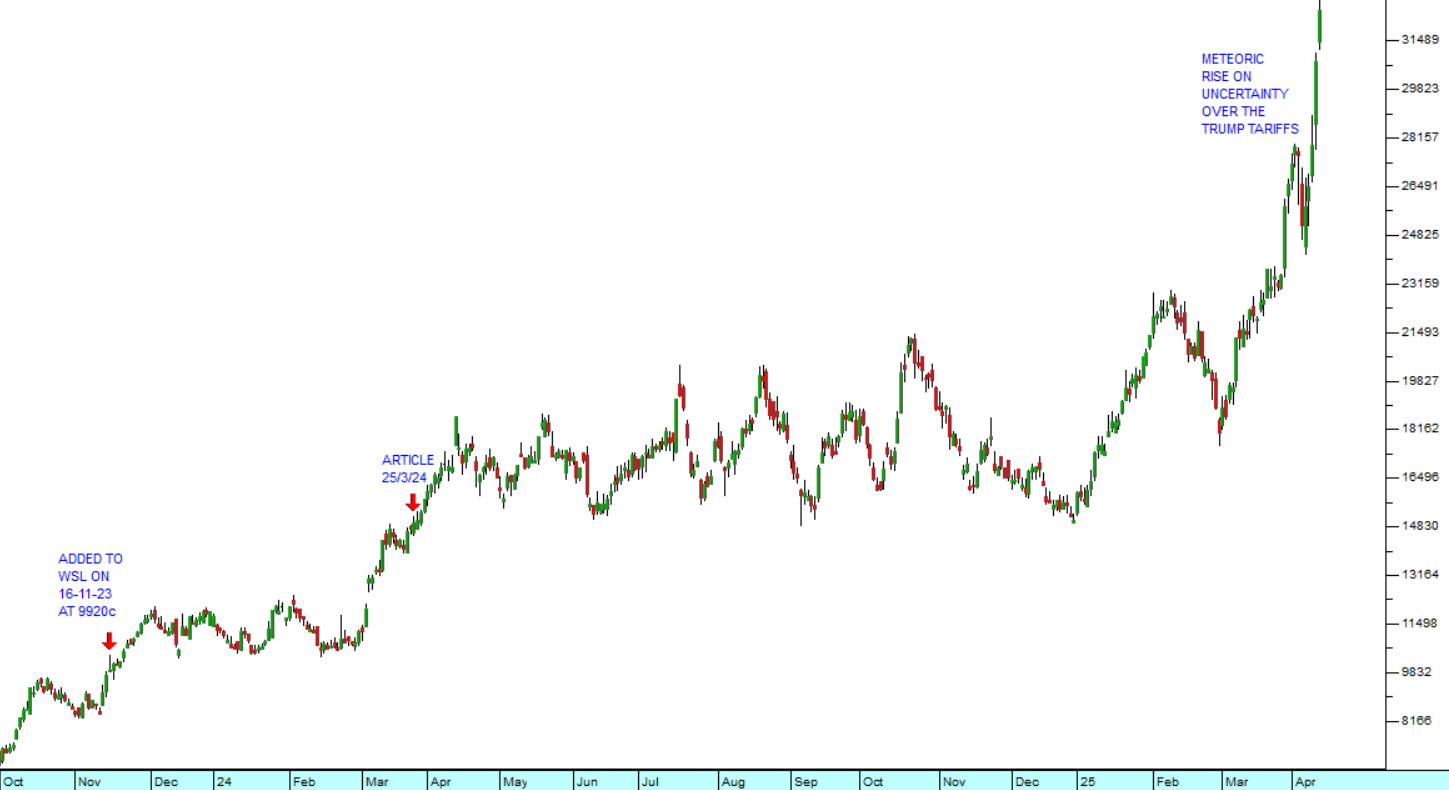
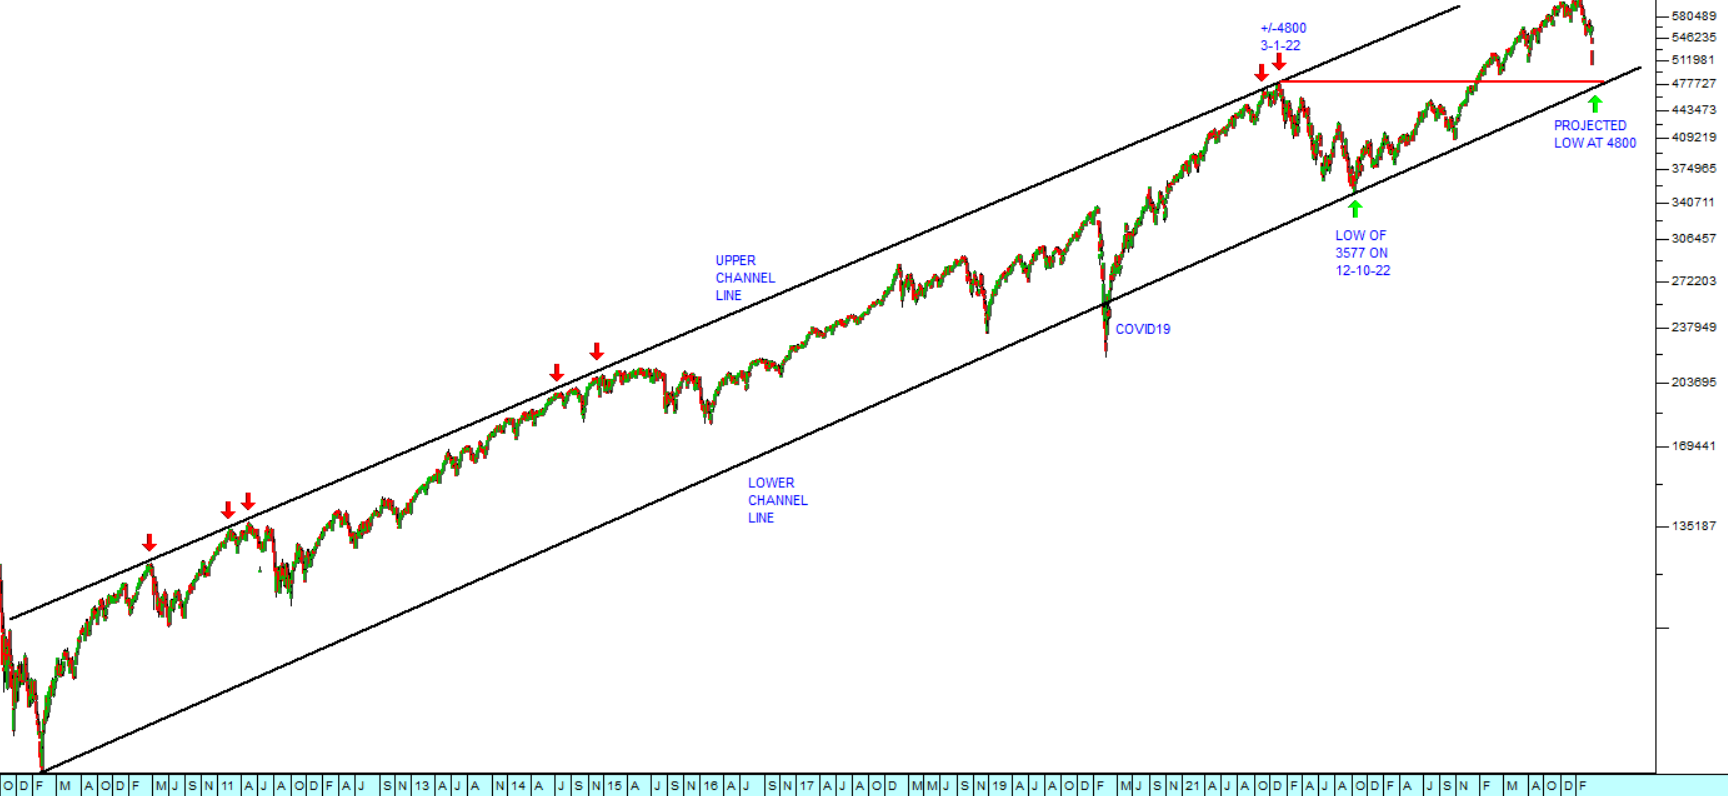
9 July 2018 By PDSNETThree months ago, on 6th April this year we wrote an article about the S&P500 and the correction up to that point. We suggested that strong support had been built by the four unsuccessful attempts to penetrate the 2581 level (the green arrows). We said that the bulls would take heart from this and drive the market higher, back towards the all-time high of 2872. Consider the current chart:
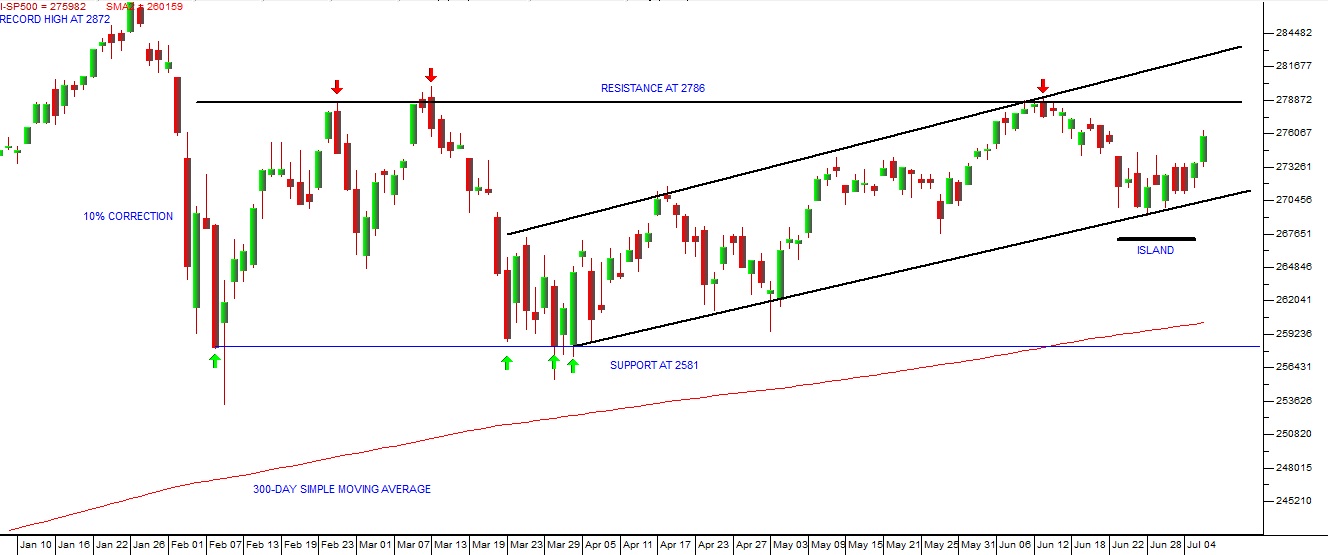
S&P500 Index January 2018 to July 2018 - Chart by ShareFriend Pro
Here you can see the complete anatomy of the correction since its inception on 26th January 2018. Since our previous article, the S&P has entered a clear upward sloping channel, defined by parallel upper and lower channel lines. Resistance at 2786 has been encountered and the S&P has fallen back from it to find the lower channel line last week on Thursday (28-6-18). The channel line held and an �island� formed. Now it is apparent that the market is moving back up to test the resistance at 2786 � which it will almost certainly do in the coming weeks. Aside from the fact that the S&P500 was overdue for some sort of retracement, this 5-month correction can probably be laid, quite substantially, at the feet of Donald Trump. He has seen fit to initiate an international trade war with some of the largest economies in the world. Anyone who has the least knowledge of economics knows that such a trade war is as pointless as it is costly. Nobody wins and everybody loses. But the US economy, driven by forces which were set in motion before Trump even thought of running for the presidency, continues to grow. And since the stock market must sooner or later reflect investors� perceptions of future economic growth, the S&P continues to look strong. Even in the midst of the correction there are clear signs that� the republicans themselves are becoming alarmed at Trump�s uncoordinated, unpredictable and blundering moves. Nobody really thinks that such a stupid policy can survive for very long. So seasoned investors are betting more and more on a resumption of the nine-year-old bull trend and that optimism is becoming visible in the chart.DISCLAIMER
All information and data contained within the PDSnet Articles is for informational purposes only. PDSnet makes no representations as to the accuracy, completeness, suitability, or validity, of any information, and shall not be liable for any errors, omissions, or any losses, injuries, or damages arising from its display or use. Information in the PDSnet Articles are based on the author’s opinion and experience and should not be considered professional financial investment advice. The ideas and strategies should never be used without first assessing your own personal and financial situation, or without consulting a financial professional. Thoughts and opinions will also change from time to time as more information is accumulated. PDSnet reserves the right to delete any comment or opinion for any reason.
Share this article: