The Confidential Report – August 2018
1 August 2018 By PDSNETPolitical President Ramaphosa has been steadily consolidating his power within the ANC and this bodes well for the country. His recent successes in the provincial elective conferences in Natal and Gauteng have seen his supporters elected to key positions in those provinces and a consequent loss of power for the Zuma camp. In Natal, the positions of deputy chairman and secretary are now occupied by Ramaphosa supporters. At the same time, in Gauteng, the position of deputy chairman was won by Lesufi – a Ramaphosa supporter. These changes will help to ensure some unity within the ruling party which has been deeply divided. That will bolster its position in the 2019 elections. Ramaphosa will only be able to address the more serious structural anomalies in the SA economy once he has a sufficiently strong grip on power. The BRICS summit held in Johannesburg has helped President Ramaphosa to move closer to his goal of bringing in $100bn in foreign direct investment (FDI) over the next five years. He already has promises of $20bn and now the Chinese president has agreed to a $14,2bn investment – so he is well on his way. He is planning an Investment Summit in October this year to create even more FDI. This ability and enthusiasm of our new president to bring foreign investment into South Africa is a potential game-changer. That foreign investment will bring new skills and create jobs and widen the tax base. It is a very effective way to move the SA economy into a strong recovery – and quickly. With South Africa’s very [glossary_exclude]low[/glossary_exclude] saving rate (the lowest in the G20 group of countries), we have to rely on foreign capital to finance any significant development in this country. This is not an unusual situation for an emerging economy, but international investors are wary of political risk and especially things like the land expropriation debate in this country. Obviously, no one wants to invest heavily into a country where the assets purchased might later be expropriated by the government without compensation.
Economy
South Africa has added thousands of new credit-active consumers since 1994. Many of these people have had access to credit for the first time in their lives and have taken advantage of this without considering the long-term consequences. A culture of “spend now, pay later” has become integral to our society and there is very little saving. This resulted in the National Consumer Act which put some of the responsibility onto the lender to ensure that the person borrowing from them could afford to repay the loan. The effect has been to slow the level of credit extension and that has obviously curtailed consumer spending somewhat. We now sit in a position where there are 25,5m credit-active consumers in South Africa – and 38% of them are at least 3 months behind on the repayments on at least one of their loans – which means they are “impaired”. The number of impaired credit users has declined somewhat over the past three years (it was almost 50% in mid-2015) which is partly a function of the National Credit Act and partly a result of the [glossary_exclude]high[/glossary_exclude] unemployment and [glossary_exclude]low[/glossary_exclude] economic growth in this country. Normally, during periods of [glossary_exclude]low[/glossary_exclude] economic growth, consumers tighten their belts and repay debt, but South Africans have a tradition of living to the full extent of their credit. This results in a very [glossary_exclude]low[/glossary_exclude] savings and investment rate – which tends to constrain future economic growth further. The Reserve Bank’s decision to cut its growth forecast to 1,2% from 1,7% for this year recognises the reality of the South African economy. The first quarter’s dismal 2,2% contraction is likely to be followed up by marginal growth in the second quarter – and so it will be left up to the last two quarters to turn the situation around. At one point it seemed possible that South Africa would again slip into a technical recession in the second quarter (defined as two successive quarters of negative growth), but that now appears unlikely. The second quarter will not, however, eliminate the 1st quarter’s bad showing – so the remaining two quarters will have to be much better- and they may well be. Agriculture and mining are both looking much better. Consumer spending is down, but will probably recover in the second half. So the 1,2% growth target should be attainable. Added to this is the general recovery in the world economy that is being led by the US. The rapid rise in the price of petrol is a major factor impacting inflation and consumer spending. The Minister has said that there is little that can be done about it because it is a function of the rand/US dollar exchange rate and the price of oil. What he is omitting to mention there is the fuel price levy – which is almost one third of the price of a liter of petrol. The fuel levy goes to the road accident fund and to the government as a supplementary tax. It has risen from R1.30 per liter in 2008 to its current level of R5.30. This obviously puts a huge strain on consumers who must pay more for a tank of petrol and hence spend less on other items. It also increases inflation since almost all products are transported by an internal combustion engine at some point in their life cycle. But the government is desperately short of funds with the national debt rising to 53% of GDP and it has massive commitments to the state owned enterprises. The petrol price has now doubled in the past ten years – which is certainly a major factor in the [glossary_exclude]low[/glossary_exclude] growth rates experienced in this country. The Eskom debt position is a major problem for South Africa. The total debt is of the order of R367bn, R350bn of which is government-guaranteed. Eskom is desperately cutting costs and trying to re-negotiate the terms of its debt. Its results for last year reveal a loss of R2,3bn which includes irregular expenditure of R19,6bn. It is also estimating that it will need to raise R72bn this year (2019) and will have to pay R215bn just in interest over the next five years. This is obviously mostly a hangover from the previous administration and the new CEO, Hadebe, is confident of turning the situation around. Certainly the new facility granted by China to provide $2,5bn (R33bn) will help enormously (thanks once again to President Ramaphosa). The National Energy Regulator (NERSA) has allowed Eskom to increase prices by just 5,2% against a request for a 20% increase. Cutting staff will help, but it is a slow process requiring negotiation with the unions. The attempt to avoid increasing salaries this year failed probably for political reasons when Pravin Gordhan stepped in. This will add further salary burdens to Eskom once an agreement is reached. In our opinion, the only long-term answer is to begin selling off individual power stations as separate going concerns with an Eskom contract to buy their electricity – in much the same way as Eskom has been handling the Independent Power Producers. Cash raised by selling power stations could then be applied to bringing the overall debt down. In the end, this appears to be the only practical solution. Eskom should not be in the power generation business – rather it should be in the power distribution business. What is apparent is that some sort of show-down with the unions is probably still going to happen over the fact the Eskom is refusing to pay workers a bonus. The unions are demanding that workers get 12% of their annual salary – and this is over and above the 7,5% wage increase already offered by Eskom. Inflation is a subtle, undisclosed form of taxation. The government increases the money supply – and spends the increase, while the rand in your pocket goes down in purchasing power terms. Robert Mugabe made good use of this mechanism (which has been euphemistically so-called “quantitative easing” by the Western world) as a source of government funding until eventually the Zimbabwean dollar collapsed completely. The continuous control of inflation is one of the primary reasons for the survival of the South African economy over the past 25 years. It is always very tempting for a government which has exhausted its borrowing capacity (as ours has) and which cannot impose further taxation on consumers and businesses, to simply print the extra money required and spend it. It is much easier and more popular than cutting government costs – which inevitably means reducing the size of the civil service. The Angolan government may have fallen into exactly that trap. Inflation there has officially reached 20% and it has been well said that inflation moves very slowly from zero to 20%, but very quickly from 20% to 100% and beyond. This is because once inflation reaches 20%, everyone begins to adjust their economic behavior to take that into account. Prices at shops are automatically adjusted upwards every three months, wages and salaries also have to be increased regularly – and then the inflation spiral takes on a life of its own, which is very difficult and painful to stop. Shoprite has 30 supermarkets in Angola and has been growing its store base there rapidly. Now suddenly the inflation rate has begun to impact their business badly. Let us hope that South Africa continues to exercise strong and rigid control over the money supply through its independent Reserve Bank.The Rand
The currency of a country is similar to the shares of a listed company. If a listed company is expected to do well and be profitable, then its shares will strengthen relative to the shares of other companies – and vice versa. The same is true of the rand. If overseas investors perceive this country to be well-run from an economic perspective, they will invest here rather than in other emerging economies. And that also depends on whether international sentiment is “risk-on” or “risk-off”. In a risk-off environment, international investors tend to pull money out of emerging markets generally and put it into safe assets like US Treasury Bills. But those safe investments always offer a much lower return than they can get from emerging markets – so as soon as sentiment shifts back to risk-on, they move the cash back to emerging economies. For example, our bench-mark government bond, the R186, trades at a yield which is about 6% higher than the US 10-year T-Bill. That precisely quantifies the political risk attached to South Africa relative to America – it is worth exactly 6% on long-term government bonds. We have been suggesting that the rand would weaken all the way back to its upper channel line at around R13.75 – and that is what it has done. Now it is back in a strengthening phase, partly because international sentiment has moved back to risk-on from risk-off. But, much of this renewed strength is also attributable to the promises of investment which President Ramaphosa has managed to extract from China and other Eastern countries. He has already managed to get promises of over $34bn – which is more than one third of the $100bn he was aiming to get over the next five years. Consider the rand’s chart: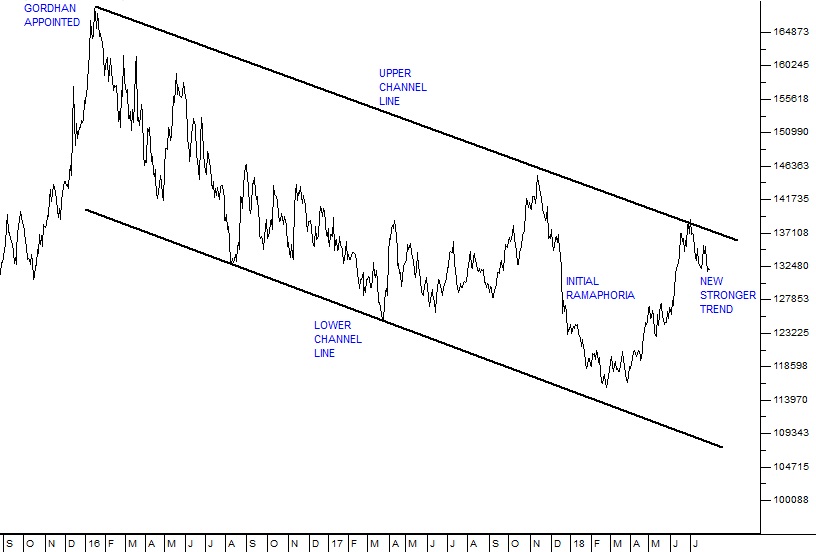
Rand Dollar Exchange September 2015 to July 2018 - Chart by ShareFriend Pro (Click to Enlarge Image)
This should be seen in the light of the 0,25% reduction in interest rates here in March which made investments into this country less attractive. So far, the Reserve Bank has not felt the need to tighten interest rates to protect the rand further and this is in contrast to other emerging market economies like Argentina and Turkey where rates have had to be hiked to protect their currencies. Besides that, nobody can really deny that, despite all the problems he has had since he took office, Ramaphosa still represents a massive “sea change” to the South African economy. He is actively and successfully looking to grow this economy through foreign direct investment. It will take some years before the full impact of his leadership is felt and, until next year’s election is over, he will inevitably feel it necessary to pander to the populists to some extent.US Economy
Luckily, Donald Trump has a reputation for backing down on most of his radical actions since taking office. He has backed down and changed his position on more issues than any previous president. So his trade war with the rest of the world must be seen in this light. His steel and aluminum tariffs are causing other countries to retaliate. Canada, Europe and China have all reluctantly announced retaliatory moves. In effect, Trump is busy trying to close down international trade – which is a stupid, populist and unsustainable move. But his measures are coming under increasing pressure - and we confidently expect him to back down on them in due course – just as he has on so many other issues, from the US national debt to the wall that he promised along the Mexican border, and his harsh border control initiatives, which have seen children separated from their parents. The steel and aluminum tariffs have impacted Wall Street negatively, so when he backs down, we can expect Wall Street (and other world markets including our own) to respond positively. The surprise jump in manufacturing growth in the US in May indicates that the world economy is starting to perform. Demand was especially strong for machinery both from inside America and outside. At current rates, the manufacturing sector, which represents about 12,5% of the US economy, will grow by around 8,8% per annum – which for such a large economy is a very rapid rate of growth. Let us now consider the technical picture of the S&P500 – which is a weighted average of the 500 largest companies trading on Wall Street: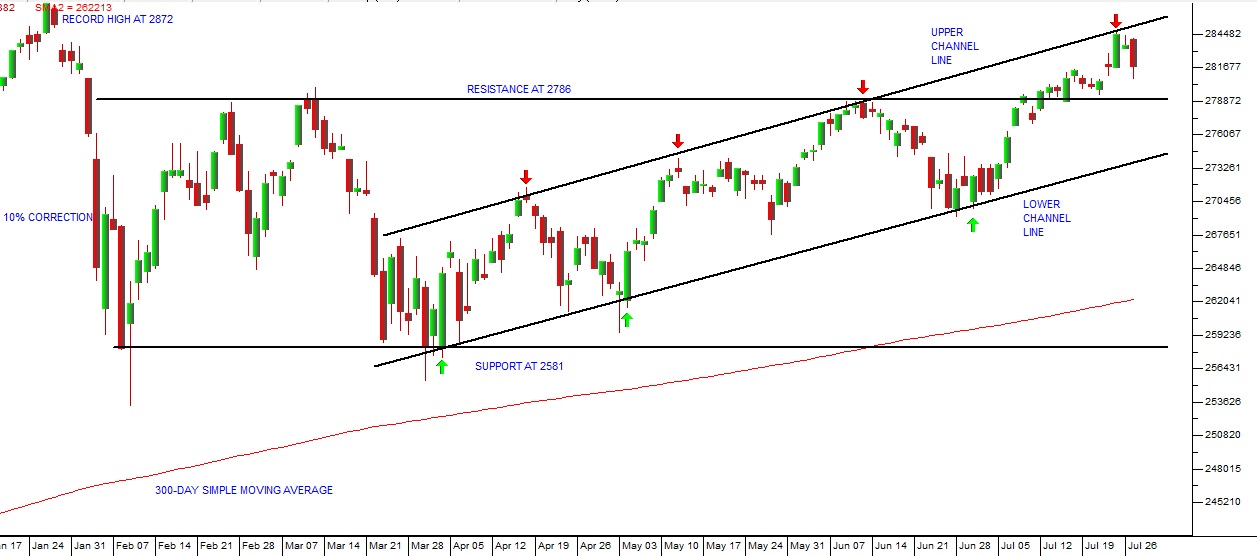
S&P500 Index January 2018 to July 2018 - Chart by ShareFriend Pro (Click to Enlarge Image)
The above chart shows the anatomy of the correction which the S&P has been going through since its record high made on 26th January this year. What is apparent is the channel which has clearly been established by the touch points on the upper channel line (indicated by the red arrows) and the touch points on the lower channel line (indicated by the green arrows). On Wednesday last week (25th July 2018), the S&P touched the upper channel line for the fourth time and fell back from this level – but remained within the strengthening channel. We expect that the S&P will continue to move steadily upwards until it breaks its previous record high at 2872 – probably sometime within the next month. Once that happens, the correction will be over and the [glossary_exclude]bull trend[/glossary_exclude] (which began in March 2009) will resume. The length of this bull trend (it is now over 9 years old) has been suggested by some analysts as a reason for the trend to end, since most post-World War II [glossary_exclude]bull[/glossary_exclude] trends have not lasted this long. We believe, however, that this bull trend cannot be compared with previous bull trends because it is being driven by the massive quantitative easing and [glossary_exclude]low[/glossary_exclude] interest rates which were applied to the world economy following the 2008 sub-prime crisis. Indeed it is our opinion that this bull trend, far from being close to its end, is actually just beginning. For more detail on this subject read “Our Background Approach” on our website under the heading “Articles”.Commodities
CHARTER
The third mining charter is being subjected to a wild public debate and the results may well be a microcosm of where South Africa is now. There is a balancing act between:- Encouraging investment (both local and international) by the application of sound economic principles, and
- The populist approach, which is not really concerned with investment or sound economic principles, and is looking for the industry to subsidise local communities and employees and to be at least 51% owned by black people.
Companies
SILVERTREE
This is a 2013 startup which seeks to capitalise on the general movement of consumer spending away from shopping malls and towards online buying. The company is currently doing a turnover of about $40m, but wants to grow through acquisition to about $300m by 2023 - and then list on the JSE to raise capital. It faces stiff competition from Naspers which is also investing in online merchandising through its increasingly well-known brands Takealot and Mr D Food. Obviously, this type of disruptive technology is going to become a feature of investing on the JSE in the future with widespread consequences. For example, it is already well recognised that there are too many shopping malls in the Gauteng area – but what if online shopping reaches 20% of consumer spend or more in the next 5 years. That would have a devastating impact on some real estate investment trusts investing in retail while boosting others investing in logistics properties like warehousing.CAPITEC (CPI)
One of the scariest elements of the Viceroy report on Capitec was its payday loan system, which Viceroy said could result in a class-action law suit and force Capitec to repay R12,7bn in fees. Capitec has now managed to force Summit Financial Partners to completely give up on the legal action which they brought in this regard. Capitec no longer offers the payday loan option because of the more stringent requirements of the National Credit Act, but shareholders will be relieved that the R12,7bn “sword of Damocles” hanging over this matter has been removed. The share has been moving sideways at lower levels since the Viceroy report was published and we regard it as good value at current levels. Consider the chart: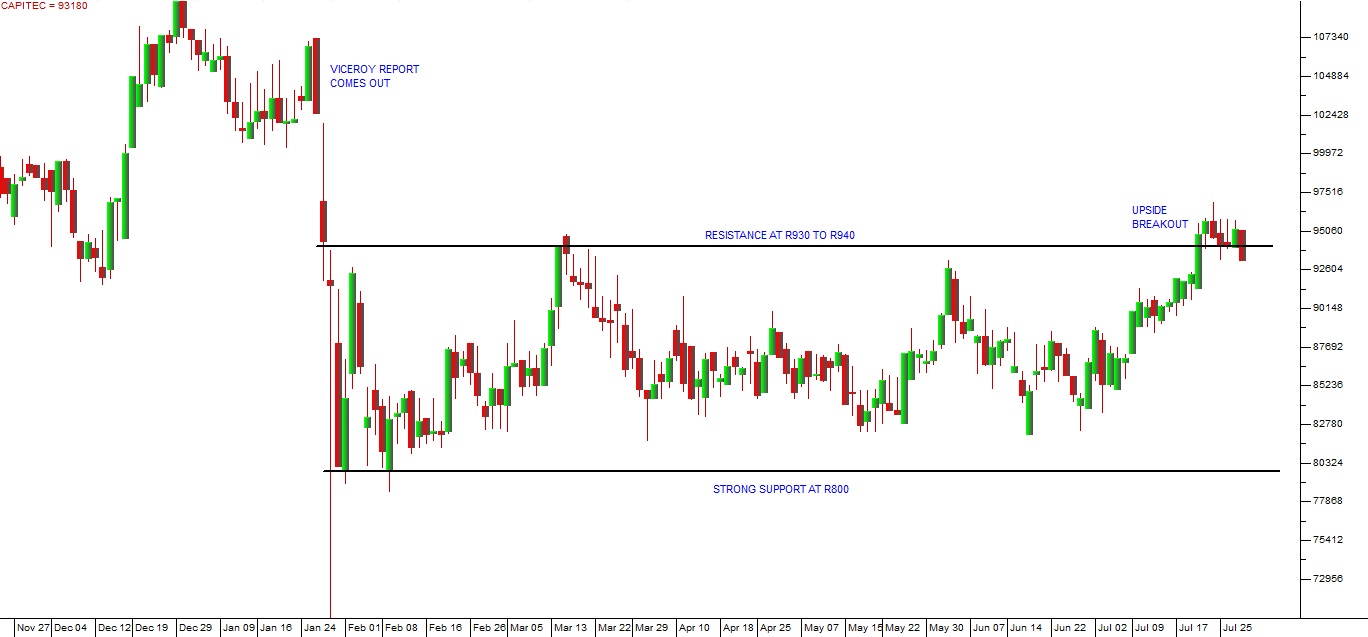
Capitec (CPI) January 2018 to July 2018 - Chart by ShareFriend Pro (Click to Enlarge Image)
You can see here that following the sharp fall when the Viceroy report was published, Capitec has been oscillating between support at around R800 and resistance at between R930 and R940. It now appears to have broken out of this sideways pattern. A point-and-figure analysis of the sideways market indicates that, now that there has been an upside breakout, the share should move up to at least R1300.GLENCORE (GLN)
Since the commodity cycle turned at the start of 2016, one of the greatest beneficiaries has been Glencore, particularly because of the fact that it owned the world’s richest source of cobalt in the Democratic Republic of Congo (DRC). Cobalt is the metal used in the batteries which will be needed by the world’s shift to electric motor vehicles. The share price went into a major bull trend in 2016 and for most of 2017 rising from 1750c to over 7000c. Since then it has made a convincing “double top” (the green arrows on the chart below), with the second top being slightly lower than the first. Technically, this is a very bad sign. The fact that the share could not rise above its top at R70 was a major disappointment to the bulls. Consider the chart: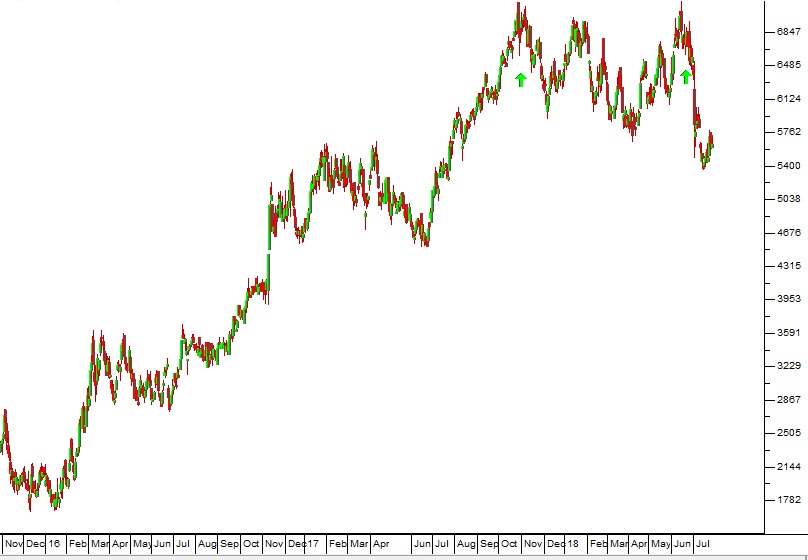
Glencore (GLN) November 2015 to July 2018 - Chart by ShareFriend Pro (Click to Enlarge Image)
Now, as you can see it is falling back rapidly. The problem is the various legal battles which it is fighting against government agencies in the DRC. To this has now been added the US government’s recently-launched corruption probe. Once again, the activities of the insiders, which created the double top, made it possible for the astute private investor to get out in time and lock in the profits of the previous 18 months.STEINHOFF (SNH)
The lock-up agreement (LUA) which has been structured and agreed to by Stienhoff’s creditors has given management a 3-year window to resolve the company’s credit crisis. It has come at a steep cost (the 10% return) but it offers shareholders some relief. In our view, this move will be followed by an approach to creditors to convert some or all of their loans into share capital – which will dilute existing shareholders. There is also the matter of the various law suits against Steinhoff by shareholders, including Christo Wiese, who lost money as a direct result of the “accounting irregularities” which the company has admitted to. All in all, the situation has become much clearer, but there are still areas of obscurity where risk exists. From a technical perspective, the advice which we gave back in December 2017 when the Viceroy report first surfaced, remains valid – not only for Steinhoff but also for other “blue chip” shares which have fallen sharply. What we said was to apply a 65-day exponentially smoothed moving average (65-day E) and wait for an upside breakout before buying. Consider the chart of Steinhoff: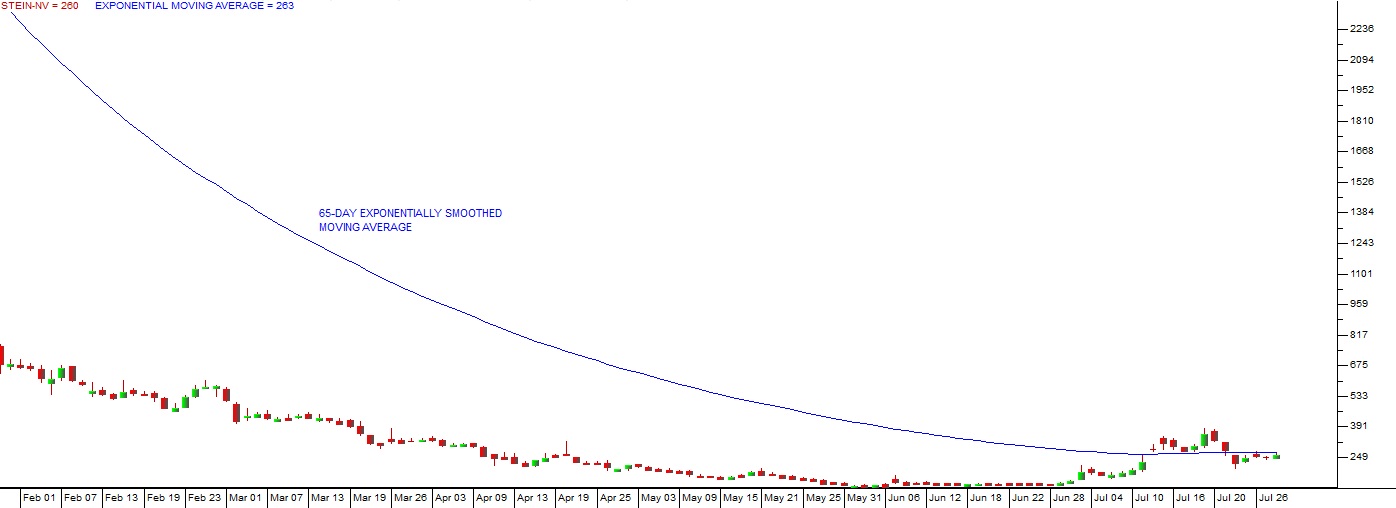
Steinhoff (SNH) February 2018 to July 2018 - Chart by ShareFriend Pro (Click to Enlarge Image)
Here you can see that Steinhoff shares spent months wallowing at very low levels during which time the 65-day E was falling steadily. Eventually, the 65-day E was broken on 12th July 2018 when the share closed at 288c. Many hopeful investors got back into Steinhoff too early when it was trading for around 465c and saw it fall further. There is, of course, still risky, but so long as you have a strict stop-loss, it may well be worth a punt.KUMBA (KIO)
The progress of Kumba’s share price over the past 9 months has been instructive. At the start of this period (September to December 2017) Kumba was benefiting from rising iron ore prices and excellent management. The share price almost doubled from R211 to R414. Then the news began to leak out that the company was having difficulties with Transnet derailments on its critical Northern Cape line and at the same time the iron ore price was weakening. The share price fell back to R265 in the first four months of 2018. Obviously Kumba was by this time working closely with Transnet to avert all the derailments and get everything working properly again – so the share price began to appreciate so that by 18th July 2018 it was back at R308. Then Kumba issued a SENS announcement to say that headline earnings per share (HEPS) would fall by 37% in the 6 months to end-June 2018 and the share price fell back on the news because some shareholders had clearly not been aware of what was going on. Consider the chart: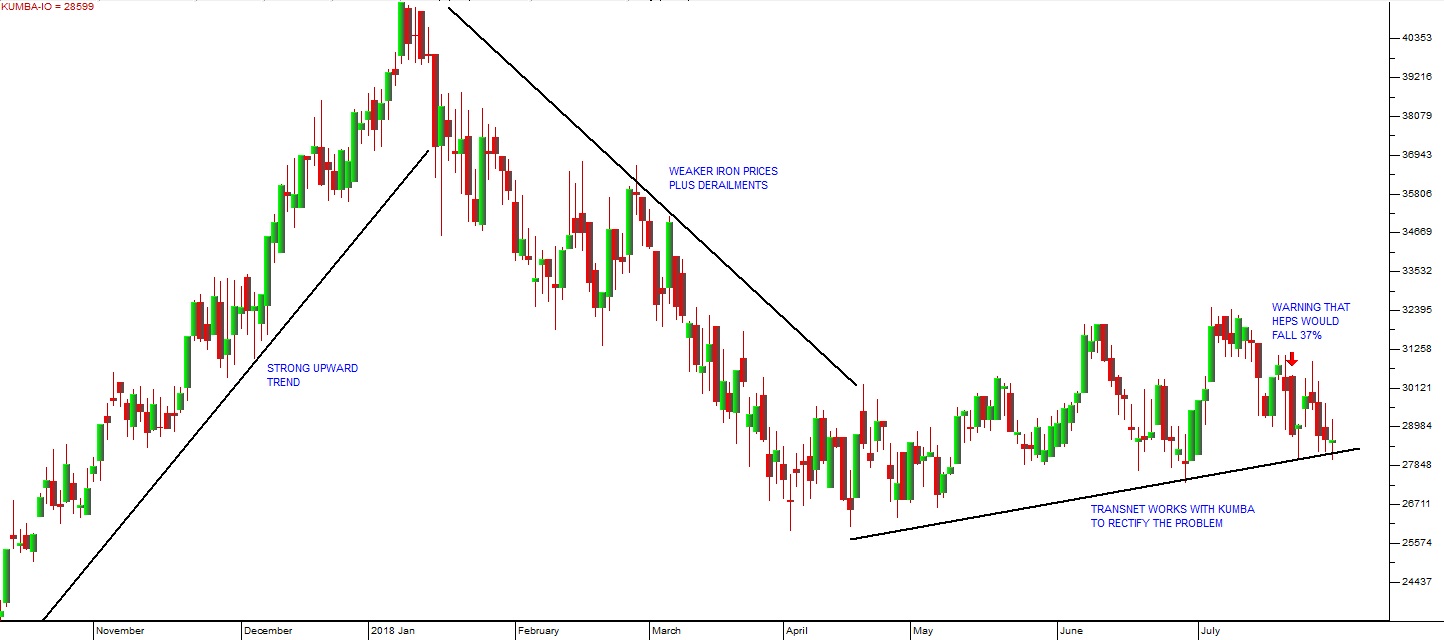
Kumba Iron Ore (KIO) October 2017 to July 2018 - Chart by ShareFriend Pro (Click to Enlarge Image)
What this demonstrates is that company reporting, even trading statements, usually come well after the events that they are reporting on have been fully discounted into the share’s price. It is always useful to keep an eye on SENS announcements, but the events which they make public have usually already had their impact. That is the benefit of watching the chart closely for signs of weakness. In January this year it was already apparent that there was something wrong with Kumba – enough to get any observant investor out of the share.DISCHEM (DCP)
For the past month, Dischem has been wallowing at around R25 per share despite its obvious potential. When it listed in November 2016 it had 108 stores. By the end of the 2019 financial year it expects to have 149 stores. The new stores are adding to revenue and bringing economies of scale which the company is now well-positioned to exploit because of its improved warehousing infrastructure. Theoretically, there is no reason why Dischem cant steadily increase its store count to equal that of Clicks, which has 600 stores and plans to increase that to 900. And that is the reason for Dischem’s relatively high rating (with a P:E of over 30). The “blue sky” potential of this share means that you should always be accumulating it on any weakness in the share price.SIBANYE (SGL)
Sibanye has recently done a “streaming deal” to raise $500m – which will enable it to cut its debt of R23bn by one third. In effect, Sibanye has sold its current and future gold and some of its palladium production in exchange for cash now. This will reduce its interest bill significantly. Obviously, from a private investor’s point of view, Sibanye is a speculation on the future of precious metals prices – which can be very volatile and which have been under pressure for a long time. Perhaps the best way to deal with this is to again apply a 65-day exponentially smoothed moving average (65-day E) to the Sibanye share price and wait for a clear upside breakout. Consider the chart: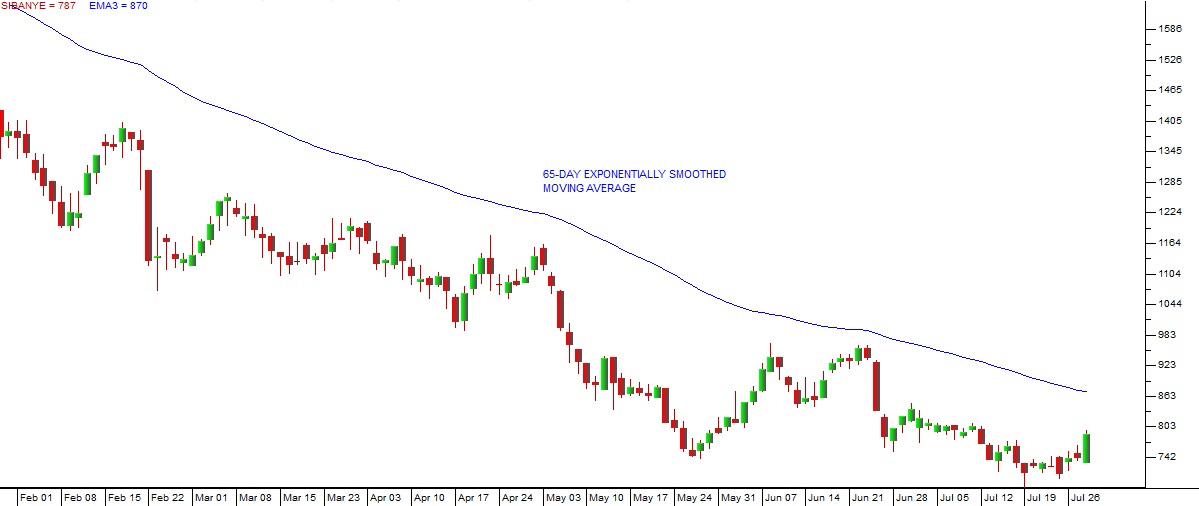
Sibanye (SGL) February 2018 to July 2018 - Chart by ShareFriend Pro (Click to Enlarge Image)
As you can see, the share has been falling consistently – and may continue to do so. The 65-day E is also falling – which means that your buy-in price, should you ever decide to take the risk, is also falling. An upside breakout is not a guarantee of profits – but it means that you have done a lot better than those who bought the share for nearly R12 about 6 months ago. Also, if you have a strict stop loss strategy your maximum risk should only be about 15%.AMPLATS (AMS)
Amplats is definitely the best of the South African platinum mining houses. Over the past five years it has laid off about two-thirds of its work force and reduced the number of mines which it operates from 18 to 7. This made it far more profitable and cash-generative than either of the two other large platinum operations in South Africa (Lonmin and Impala). It has actually paid out a dividend of 374c after the first six months of the year. The main positive is the fact that it has managed to wipe out its debt of R6bn. It is concentrating on developing its Mogalakwena mine and its Matotolo mine. The great benefit of Mogalakwena is that it is an open-cast mine with none of the costs and problems of the usual deep-level mines. We believe that, while there is still obviously risk attached to any commodity share, this company represents good value at current levels.CURRO (COH)
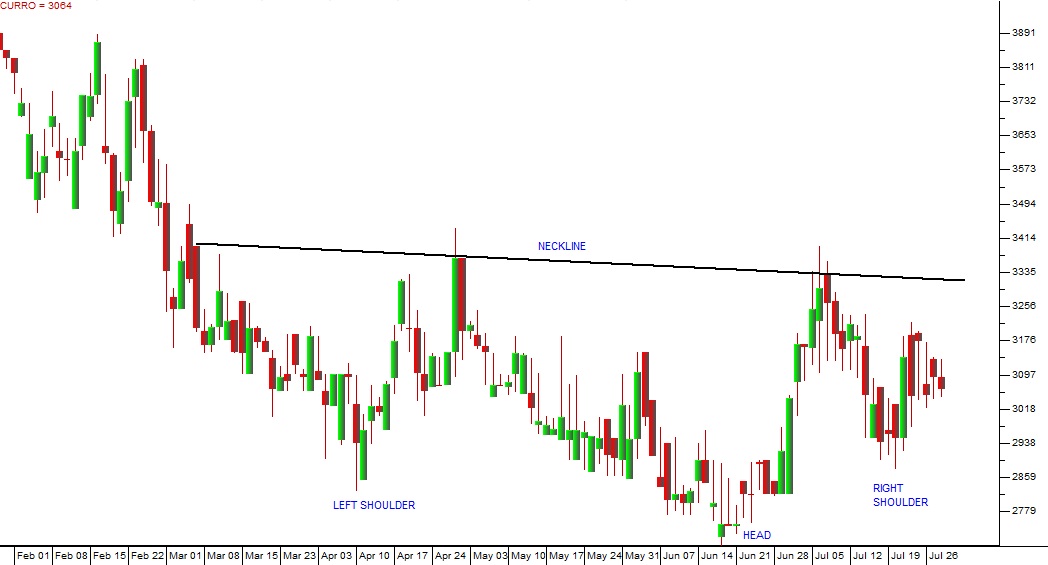
Curro Holdings once traded at one of the highest price:[glossary_exclude]earnings[/glossary_exclude] ratios (P:E) ever recorded on the JSE. On the 30th of December 2015, Curro recorded a P:E of 245,43 at a price of 5710c. Of course, that was the last trading day of 2015 so there must have been some institutional “window dressing” involved. Nonetheless, a P:E of over 245 is amazing. The P:E ratio divides the price of a share by its most recently reported annual earnings. So another way of looking at it is that shareholders who paid 5710c for Curro on 30 December 2015 would require 245 years of those earnings to get that price back out of the company’s earnings. Given that the average P:E of the JSE on that same day was 19,3, you can see that Curro was massively and unsustainably over-priced. Since then the share has more than halved to a low of 2750c before recovering to 3049c. Of course, this period includes the hiving off and separate listing of Stadio (Curro’s tertiary education arm). And we see the formation of an "inverse head-and-shoulders” which might indicate that the share is poised for more upside potential. Consider the chart: