Bitcoin Revisited
21 May 2018
By PDSNET
th of December last year we wrote an article on the extraordinary rise in the US dollar price of Bitcoin. We suggested that what we were looking at was an asset bubble that would inevitably burst – mainly because its chart was exponential – and that cannot be sustained. We compared it to the Tulip Mania which gripped Holland in the 17th century.
A few days after our article, Bitcoin’s price began to “tank” falling from $18 786 to $7 246 in just six weeks. Then it stabilised and managed to rise off that low to make a new cycle high at $11538 – where it made a clear "double top formation". Look at the chart:
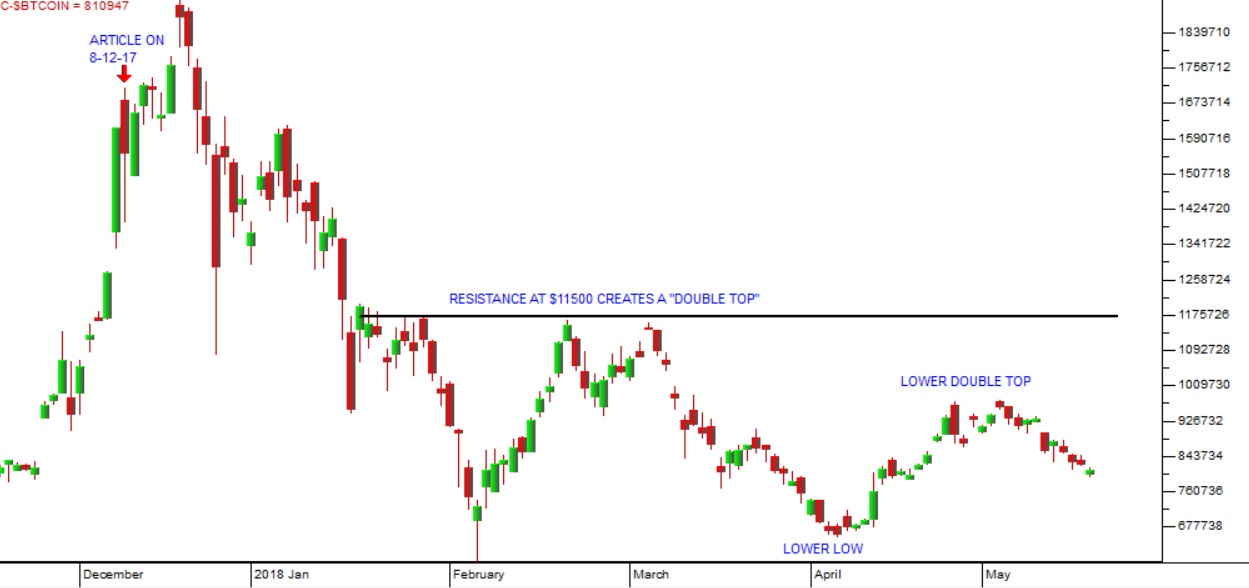
Bitcoin (B-$BTCOIN) November 2017 to May 2018 - Chart by ShareFriend Pro
As usually happens, the price then fell back on disappointment making a new lower low at $6 582 on 6-4-18. It then rallied to make a new double top – but at a considerably lower level.
Essentially, what we are seeing here is a bearish technical pattern of lower highs and lower lows. We fully expect the current downtrend to go lower than the previous low at $6582.
The problem with Bitcoin and many other investments is that the private investor never really has enough information to make a well-informed decision. For this reason, it is important to become an expert at interpreting what you see in the charts. That will show you how the insiders are trading – and right now it looks to us as if a large holder (or holders) of Bitcoin is quietly liquidating his position and taking profits. The euphoria is giving way to concern and there are a number of negative articles coming out. Certainly, anyone who bought at the top has seen their investment halve.