The Confidential Report - August 2017
1 August 2017 By PDSNETCentral banks around the world have a dual mandate – to maintain the stability of the currency and to promote growth in the economy. These two objectives are usually mutually exclusive. In other words, stimulating growth is inevitably inflationary, while controlling inflation usually results in lower growth. So, the Reserve Bank, through its Monetary Policy Committee (MPC) balances these two purposes – sometimes pressing their foot on the accelerator and sometimes on the brakes. The MPC usually meets every two months to re-assess the economy and the medium-term prospects for inflation. If they think that inflation is going to rise to unacceptable levels in the future, then they will raise interest rates. If they think that inflation is under control and the economy is not growing then they might reduce interest rates to stimulate growth. The point is that this approach, which is used all over the world, is a well-worked out mechanism that has been achieved by much trial and error over hundreds of years and across hundreds of central banks. The [glossary_exclude]Reserve[/glossary_exclude] Bank’s independence in making these decisions is also a fundamental principle of most capitalist democracies around the world. So, any suggestion that the ANC or the Zuma camp is going to come up with a more effective method is highly unlikely. The real reason that the Zuma/Gupta camp is seeking to change the Reserve Bank’s mandate is that they want to control the money supply. This would enable them to print money, Robert Mugabe-style, whenever the government was short – and we all know how that ended for Zimbabwe. The one factor that has maintained South Africa and kept it from becoming a “banana republic” since the ANC took over has been its strict control over the money supply and hence the relative stability of the currency. The books always have to balance and government spending has always been constrained to operate within its budget. Inflation is a subtle and undisclosed form of taxation – the government prints more money and spends it while the rand in your pocket goes down in purchasing power. Fortunately, the independence of the Reserve Bank is entrenched in our constitution and that requires a two-thirds majority to change – so even if the EFF sides with the ANC they cannot make such a change legally. Notably, the new Public Protector has now had the facts of life explained to her and decided to withdraw her proposal to change the Reserve Bank’s mandate. This ignominious withdrawal emphasises the stark differences between her and her predecessor. We cannot hope to run an efficient democratic economy until we have well-educated people in key positions.
The Rand
The progress of the rand has been interesting, especially since the firing of Pravin Gordhan and the downgrades. Contrary to all expectations, after an initial period of weakness, the rand now appears to be resuming the strengthening it began in January last year. The pattern takes the form of significant resistance at particular levels - which is then overcome after a period of about six months. Consider the chart: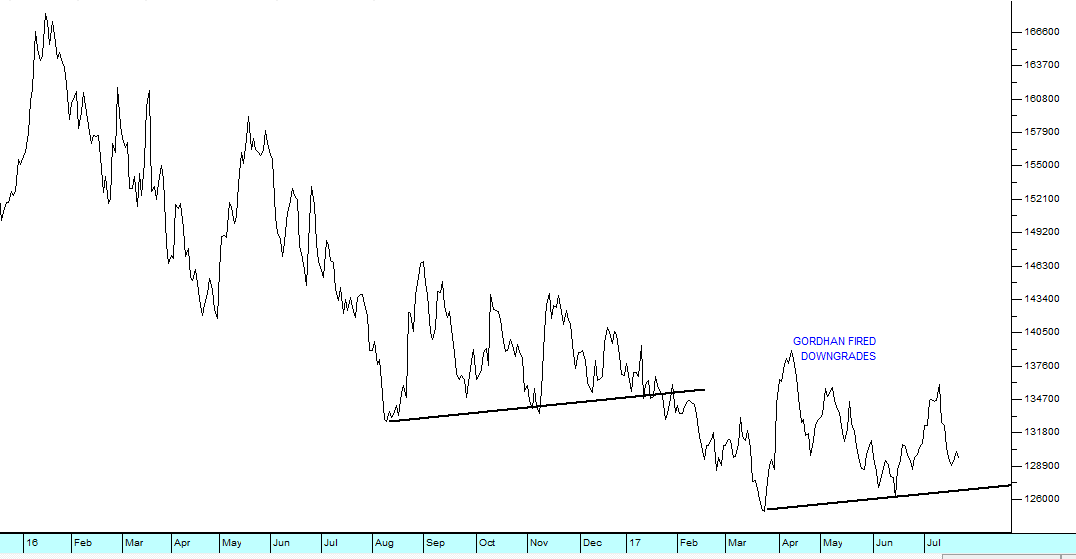
Rand Dollar - Chart by ShareFriend Pro
Here you can see the resistance at around R13.30 to the US dollar, which held the rand up from August last year until January this year. This has been followed since the firing of Parvin Gordhan and the downgrades, by a new resistance at R12.50, which has been in place now for about four months. Currently, the rand seems, once again, to be making an effort to break convincingly below that level. This pattern is probably more to do with dollar weakness than rand strength. The dovish comments of Janet Yellen (Governor of the US Federal Reserve Bank) have pushed the dollar lower against most hard currencies and ushered in a period of renewed strength for emerging market currencies. One of the impacts of the stronger rand has been to allow space for the recent decision by our Reserve Bank to cut interest rates by 25 basis points (0,25%). A key consideration in reducing rates is how it will impact on the strength of the rand. Investing in South Africa is attractive to overseas investors because they can get a rate of interest which is far better than is available in the first world. Reducing that return can result in a flight of capital. This decision to reduce rates is also significant because it ushers in a new period of falling rates. Falling interest rates will help restore some confidence to the South African economy over time.The Economy
Right now, the South African economy is in a parlous state. We have just had two consecutive quarters of negative growth which places us in a technical recession, the Reserve Bank has lowered its forecast for GDP growth to just 0,5% and unemployment is standing at a record [glossary_exclude]high[/glossary_exclude] of 27,7%. The effect of all this can be seen in the sharp slow-down in consumer spending. The Finance Minister’s 14-point plan for recovery appears to be yet another ANC-generated plan, very similar to Zuma’s 2015 9-point plan, and will probably never be implemented. Every year we have thousands more newly-qualified school and university leavers who cannot be absorbed into the labour force. In our view, the primary problem is that labour legislation is heavily skewed in favour of employees and against employers. For small and medium sized businesses, the red tape surrounding the firing of a staff member is horrendous – with the result that most businesses would prefer not to hire them in the first place. For large businesses which employ large work forces, the union problem is getting out of hand. Another strike in the metal workers union is looming. If it occurs it will place many businesses of all sizes in jeopardy – and almost certainly result in a drop in the total employment numbers in that sector. Undoubtedly, the South African economy will survive all these problems and even thrive – but that will be despite the government rather than because of it. Fortunately for us, we will inevitably continue to benefit from the general recovery of the world economy. Eskom currently has R478bn in debt and that is expected to rise to above R500bn in the next two years. It is plagued by allegations of corruption and is currently being run by an acting CEO, Johnny Dladla, its sixth CEO in three years. Eskom recently postponed the presentation of is results to parliament amid rumours of concern by major creditors. The recent results coming out of Massmart, Woolworths and Shoprite show that the consumer in South Africa is in survival mode, buying only what is necessary to live and foregoing all luxury. In this difficult environment, and with the Consumer Price Index falling to 5,1% in June, the Monetary Policy Committee has decided to reduce interest rates by 25 basis points (0,25%). Such a small cut in rates will have a small [glossary_exclude]cumulative[/glossary_exclude] effect over the coming months as bond-holders, for example, pay slightly less. The primary impact of a move like this is psychological, because it signals the start of a new easing cycle. The real hope for the South African economy, however, lies where it has always been – in a recovery of exports of mainly raw materials. The decision by the Monetary Policy Committee (MPC) to reduce rates signals a change in the direction of its policy from protecting the stability of the currency to stimulating growth in the economy. This must be prompted by the fall in the Consumer Price [glossary_exclude]Index[/glossary_exclude] (CPI) to 5,1% with further falls likely. This has given the MPC some head-room to reduce rates and further rate decreases may be expected. Over time a pattern of declining interest rates will have a positive impact on the economy, especially if it is accompanied by other economic reforms and strong foreign demand for our raw materials. The horrendous debacle which is SAA has had one positive outcome. It has forced our populist Finance Minister to resort to selling state assets to fund the R2,2bn cash injection that he needed to give SAA so that they didn’t default on their Standard Bank loan. He will probably sell the government’s 14,6% stake in Telkom – because it is already listed on the JSE and thus easy to evaluate and get rid of. The stake is worth around R14bn – which would cover the R2,2bn injection and go quite a long way towards repaying SAA’s government guaranteed debt of R13,8bn. Perhaps, the Minister should also now consider breaking up SAA and selling off the bits for whatever he can get. There really is no point is sustaining this loss-making state airline.Listings Boom
In previous Confidential Reports, we have described quite extensively how and why we see the current bull market, which has been in progress over the past 8 years since March 2009, continuing and even accelerating as it discounts the excessive monetary policy stimulation of the last ten years. One aspect of a bull market like this is usually a “listings [glossary_exclude]boom[/glossary_exclude]”. Already, we have seen an increasing number of companies come to the JSE, such as Dischem and Kaap Agri. And there has been a spate of “special purpose [glossary_exclude]acquisition[/glossary_exclude] companies” (SPACs) like Long4Life and others. This is looking more and more like the early stages of a listings [glossary_exclude]boom[/glossary_exclude]. The last listings boom occurred in 1998 and became known as the “dot-com” boom. It was characterised by intense excitement over the internet and advances in telecommunications such as the cell phone. Valuations of newly listed shares soared as investors scrambled to buy into the latest “killer app”. Literally dozens of new companies came to the market – some of them without even having a specified product, business or objective. It was not unusual to see four or five new listings in a single week. In America, most of these new companies were listed on the NASDAQ, which is a US market catering mostly for technology and communications shares. The NASDAQ [glossary_exclude]index[/glossary_exclude] in America rose in 18 months from 1509.45 in October 1998 to a high of 4914.79 by March 2000. Consider the chart of that time: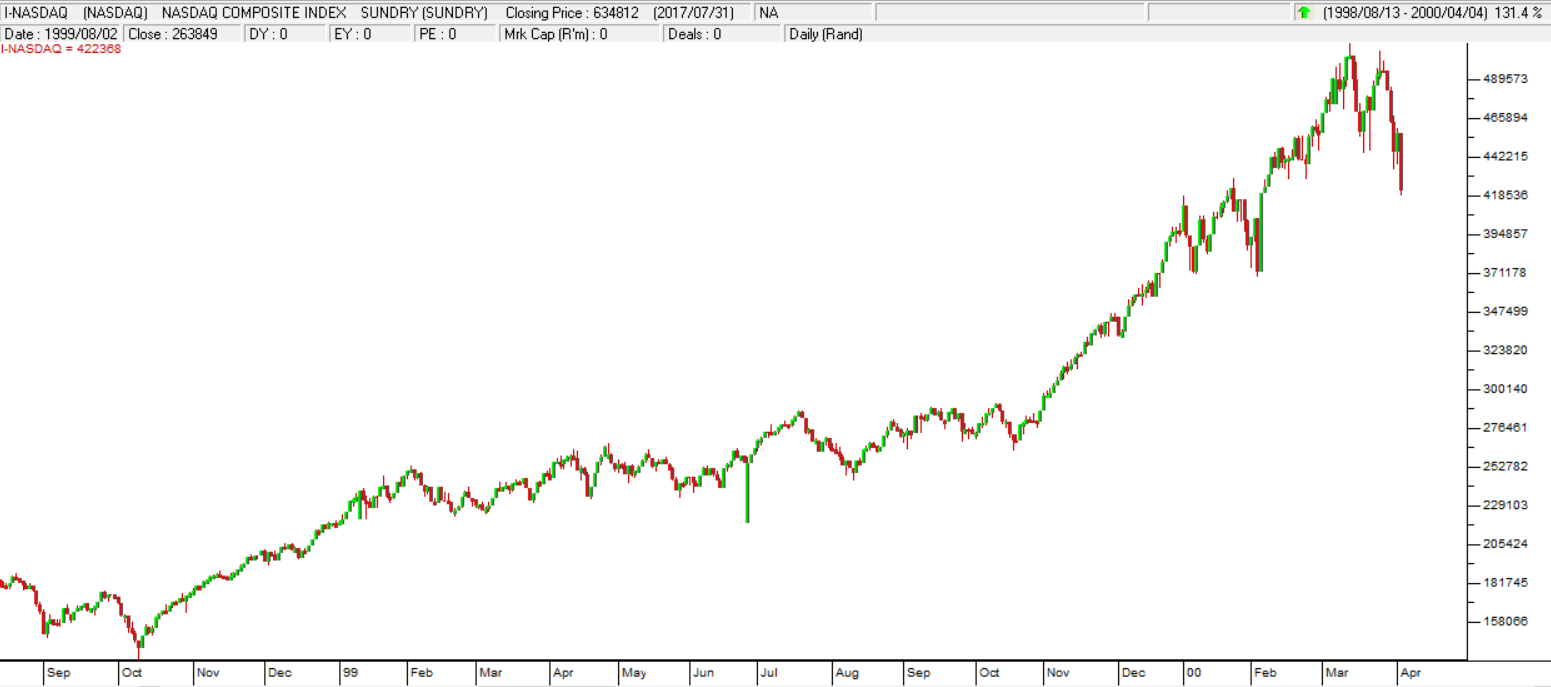
Nasdaq Composite Index 1998 to 2000 - Chart by ShareFriend Pro
You can see that the listings boom really gained [glossary_exclude]momentum[/glossary_exclude] towards the end of 1999 and in the first three months of 2000. Then the market collapsed and most of those newly listed companies just disappeared. Those that survived lost as much as 90% of their peak value. Probably the best known JSE share which listed during the 1998 listings boom was EOH. Its shares went up with those of other tech companies and then also collapsed. In the dot-com crash, EOH fell from a peak of 300c per share to just 70c – but, of course, since then it has become one of the great success stories of the JSE and has grown steadily to reach over R100 per share.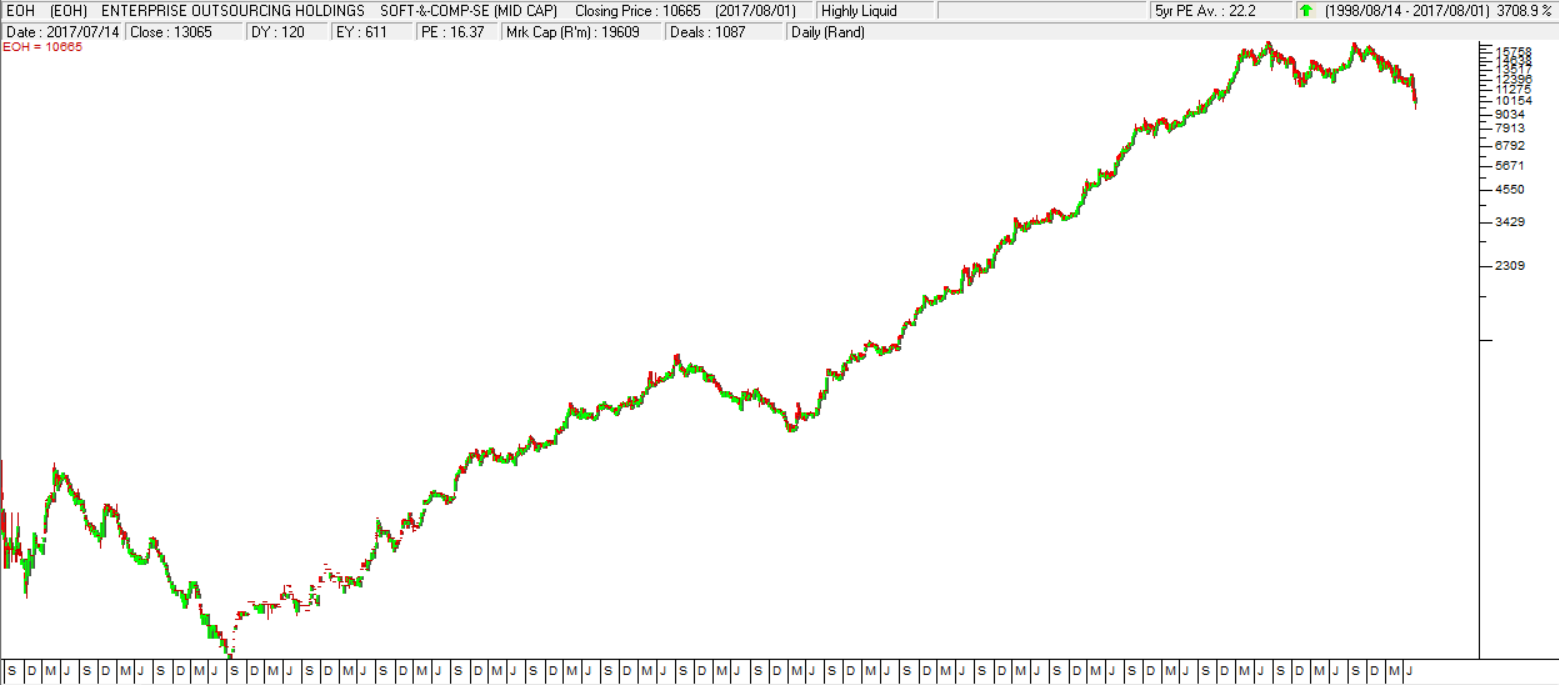
EOH 1998 to 2017 - Chart by ShareFriend Pro
A listing is a method by which owners of companies can get new capital to grow their business and diversify some of their risk, but a listing is [glossary_exclude]expensive[/glossary_exclude] to obtain and to keep. This can be seen from the fact that Moneyweb, which also listed during the 1998 dot-com boom, finally took the decision to de-list to save costs this year. The world-wide bull market is being led by Wall Street and the primary driver on Wall Street has been the tech stocks. The most recent example is Netflix which recently reported that it has increased its [glossary_exclude]subscriber[/glossary_exclude] base to more than 100 million people. The share went up 13,5% in a single day (18-7-17) driving the S&P up to yet another record close. Netflix has capitalised on a shift in the way in which consumers seek and enjoy entertainment. They want it online and they want it [glossary_exclude]cheap[/glossary_exclude] (around $10 per month or less), and convenient. The spread of high-speed internet has made this possible – even here in South Africa. The founder of Netflix, Reed Hastings, calls this “pick and mix on demand”. The interesting thing is that Netflix has not actually made much money yet. It is still building up its [glossary_exclude]subscriber[/glossary_exclude] base – so investors are really interested in the “blue sky” potential of such a massive and growing subscriber base. The important point about listing is that it makes your shares tradable through an organised exchange. This improved tradability significantly increases their value because they can be bought and sold quickly and easily over an online trading platform. An unlisted company, which does not have this advantage, will typically be worth between 3 and 5 times its annual after-tax profits (called its “multiple”), while a listed company can be worth anything from 10 to 100 times its annual after-tax profits depending on what business it is in and how successful it has been. This major difference between the value of listed and unlisted companies creates an opportunity for those more astute CEO’s to exploit the listing process and [glossary_exclude]leverage[/glossary_exclude] their company’s value enormously. One of the most important factors in any new listing is that it should have “scale”. This means it needs to be big enough to attract the attention of the big institutions (insurance companies, pension funds and unit trusts). If it is too small for the big institutions to bother with then it will only be able to attract private investors and that will significantly reduce the success of the listing. One of the most successful ways to achieve scale, is to buy up your competitors before or shortly after coming to the market. The normal way to do this is to form a new company (“Newco”) and then get that company to buy your company from you for Newco shares - and then buy other companies, also for shares at between 3 and 5 times their annual after-tax earnings – on the understanding that Newco will shortly be listed on the JSE. Once Newco is listed, it’s shares will be re-rated to at least 10 times annual after tax earnings, and a huge capital gain can be realised. Listed companies can always do this – use their more expensive listed shares to buy the much cheaper “paper” of unlisted competitors and so boost their earnings. During a listings boom, playing this type of “[glossary_exclude]P:E[/glossary_exclude] game” becomes part of the rush to the market. Of course, this strategy depends on a buoyant market where Initial Public Offers (IPO’s) are well received by enthusiastic investors. Right now, that does not exist, but there is evidence that more and more companies are coming to the market. As valuations improve in a bull market, raising capital by selling equity becomes more and more attractive. Companies see other companies coming to the market successfully and decide to do the same thing. The benefit of listing to the owners of a company is their shares suddenly become a very valuable and tradable asset. Without losing control of the company, they sell a large chunk of stock and generate millions of rands.Wall Street
The US economy is recovering rapidly from the protracted recession (also sometimes called “the great recession”) which followed the sub-prime crisis of 2007/8. To extract itself from that recession, the Federal Reserve Bank dropped interest rates to zero and engaged in an aggressive quantitative easing (Q/E) program that saw trillions of dollars created and pumped into the economy. Since 2015, the Fed has ceased Q/E and has begun slowly raising rates. So far rates have reached between 1% and 1,25% - and in the latest monetary policy committee (MPC) meeting it said that it would commence a bond-buying program to reduce liquidity in the economy. The MPC said it was concerned that inflation in the US had remained stubbornly below its target of 2% - indicating that there was still a danger of deflation and that Q/E still had not manifested in rising prices. When a central bank buys bonds, it takes cash out of the economy and vice versa – these activities are known as “open market operations”. Of course, the renewed growth in the economy is being expressed in rising corporate profits and this has caused the S&P500 [glossary_exclude]index[/glossary_exclude] to continue its steady bull trend. Consider the chart: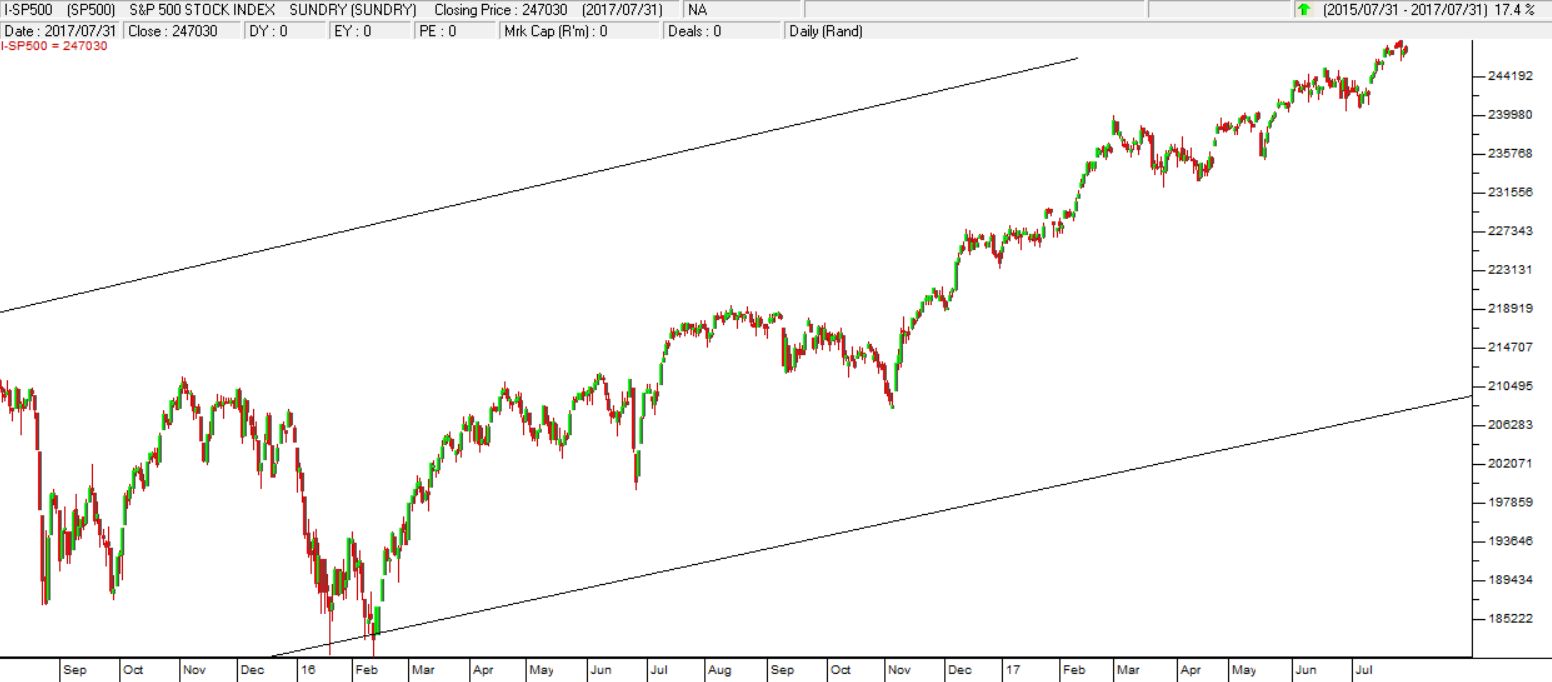
S&P500 Index - Chart by ShareFriend Pro
This chart shows that the S&P is close to the long-term upper channel line and looks ready to break above the important 2500 level. This should lead experienced investors to anticipate some sort of correction. Nothing in the markets moves in a straight line and bull trends are inevitably broken by corrections periodically. The current strong rise has not seen a material correction for at least 8 months. We expect a pull-back of maybe 10% in the not-too-distant future. But we also believe that this pull-back, when it occurs, will not [glossary_exclude]signal[/glossary_exclude] the end of the bull [glossary_exclude]trend[/glossary_exclude] and so should be viewed as a buying opportunity.CONSENSUS
In America, CNBC conducts a regular survey of 16 leading investment strategists to find out what their forecast is for the S&P500 [glossary_exclude]index[/glossary_exclude] by year-end. The average of these forecasts is 2475 – which considering the S&P closed at 2476 on 1st August – is hardly a valuable forecast. Their opinions vary from a low of 2275 to a high of 2700. This “consensus” forecast shows that analysts world-wide base their prediction on what is already happening. Very few of them dare to “think outside the box”. The most bullish is Morgan Stanley which recently upped its forecast to 2700 – based on the fact that the S&P just keeps on going up. Our forecast made on the basis of a horizontal count using the point-and-figure method is 3027, but then that is not necessarily by year-end. We continue to believe that the S&P will continuously surprise on the up-side.Political
It is apparent that the Zuma camp came out of the ANC policy conference weaker and in retreat. None of their four objectives were met:- The Reserve Bank is unlikely to be nationalised and (as was patiently pointed out to them) the nationalisation of the Bank would not in any way change its functioning or put it under the control of the government. Its mandate is entrenched in the constitution.
- Mineral Resources Minister Zwane’s proposed mining charter did not receive any endorsement from the ANC. This charter is a recipe for disaster in a sector that has already been substantially demolished.
- The ANC voted against the adoption of the phrase “white minority capital”, a phrase which was created by Bell Pottinger to obscure and obfuscate the debate on state capture.
- And the principle of land expropriation without compensation was not accepted. The protection of property rights is a fundamental principle of our constitution. Without it our descent into economic chaos would be rapid.
Companies
MANAGEMENT DIFFICULTY SCALE
As a private investor, you need to consider carefully the industry that you invest in. Some are more risky than others. In fact, you can think of share market investments on a “management difficulty scale” from very risky to almost risk-free. Mostly, this comes down to working capital considerations. Working capital is the cash which a company has tied up in its day-to-day operations. It can be calculated by adding the company’s stock to its debtors and then subtracting its creditors. A normal manufacturing concern would have money tied up in raw materials, work-in-progress and finished goods. At the same time, it would be allowing its customers up to 90 days to pay for their purchases – which means that some of its cash would be tied up in its debtors book. It may also owe money to other companies which supply it with, for example, raw materials. These “creditors” are helping to finance its working capital and so can be subtracted. The least risky companies on the JSE are those which have little or no money tied up in working capital. Typically, service companies have minimal stock and often charge up-front for their services so they have no debtors book. At the same time, they can arrange for their suppliers to give them credit in the normal way. This means that they can actually end up with negative working capital. So, on a scale from the easiest to the most difficult companies to run, a company in the chicken industry is at or close to the most risky for the following reasons:- Chicken producers have millions of rands worth of stock at any point in time.
- They have to have huge amounts of capital tied up in manufacturing facilities.
- It is an industry which everyone thinks is easy to start by raising chickens in their garage – so it is plagued by thousands of small, short-term, semi-formal “mom-and-pop” operations who constantly undercut chicken prices and make it difficult to operate.
- Chicken farms generally have a large unionised labour force and so are constantly subject to union action.
- The industry in which they operate is plagued by dumping of [glossary_exclude]cheap[/glossary_exclude] chicken on the South African market, especially by Europe and Brazil.
- Chickens are subject to diseases which spread quickly and can result in the need to cull vast numbers of chickens – like Newcastle disease or Avian flu.
LONG 4 LIFE (L4L) – DOUBLING DOWN
Two months ago, we suggested that special purpose acquisition company (SPAC), Long 4 Life was a possible good investment because it was launched by Brian Joffe (previously of Bidvest) and he had appointed Kevin Hedderwick as CEO. The company has just bought Holdsport which owns Outdoor Warehouse, Sportsman’s Warehouse, First Ascent, Capestorm and Second Skins and African Nature. The group is one of the more resilient retail outlets in South Africa and will benefit directly from any economic recovery. It seems that Joffe may initially have got a very good deal, considering the pressure that retail is under at present. And then the deal was sweetened in a manner which left at least some major L4L shareholders disappointed – and thinking that too much had been paid. They off-loaded their shares and L4L, which had been rising strongly, plunged 22.3% in a single trading day. Consider the chart: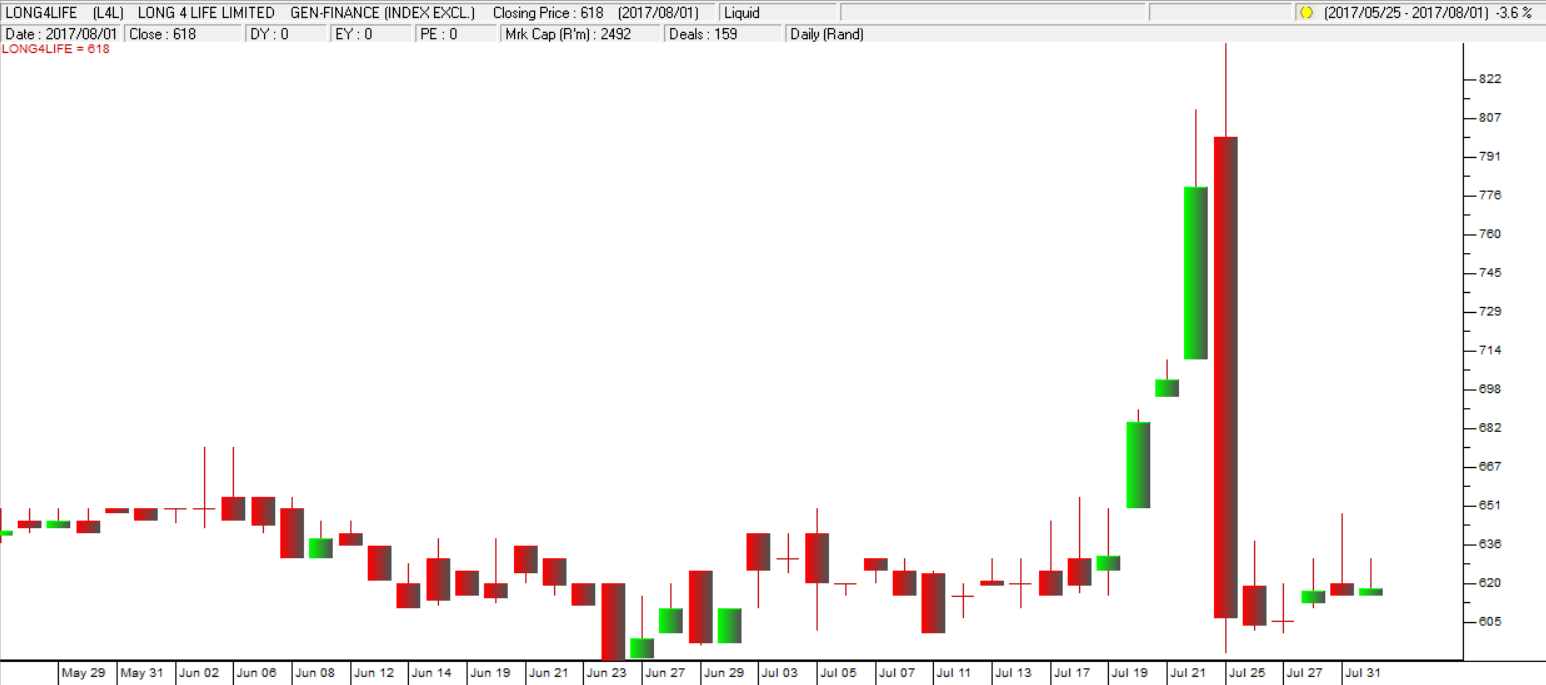
Long 4 Life (L4L) - Chart by ShareFriend Pro
This is an almost unheard-of move in a high-quality share and raises the question of what the private investor should do in a situation like this where his/her stop-loss levels may have been broken convincingly. If this happens to you then you have two options. The first option is to sell out and take your loss, on the basis that your decision to buy was wrong – at least in its timing, if not in both timing and selection. The other option is to double down at the lower price. This means buying more of the share and so bringing your average cost down. The problem with this is that you will increase exposure to the share – so you need to be doubly certain of your reasons for owning the share. In the case of L4L the primary reason for buying and holding the share are the two men who are behind it – Brian Joffe and Kevin Hedderwick. It would be difficult to find two men with stronger track records of growing businesses in South Africa and abroad than these two men. So, our advice would certainly have been to double down and wait for their undeniable skills to manifest in the share price. And that is exactly what we did. We managed to double our position in the share at 610c on 25th July 2017 – and so far we are happy with the result. Obviously the additional exposure involves a sharply increased risk and so we are monitoring our stop-loss levels more closely than ever.ASPEN (APN)
Aspen is led by Stephen Saad, CEO who was instrumental in building the business up, mainly by acquiring pharmaceutical brands and expanding his operations internationally. He personally held 12% of Aspen’s shares, worth close to R16bn. The company has recently come under the whip for raising prices on certain drugs excessively and has been fined 5,2m euros by Italy and has a similar investigation outstanding by the EU. This and other factors have brought the share price down from around R443 in January 2015 to current levels around R285. In our view this share represents a good opportunity at this level and has recently found support at around R274.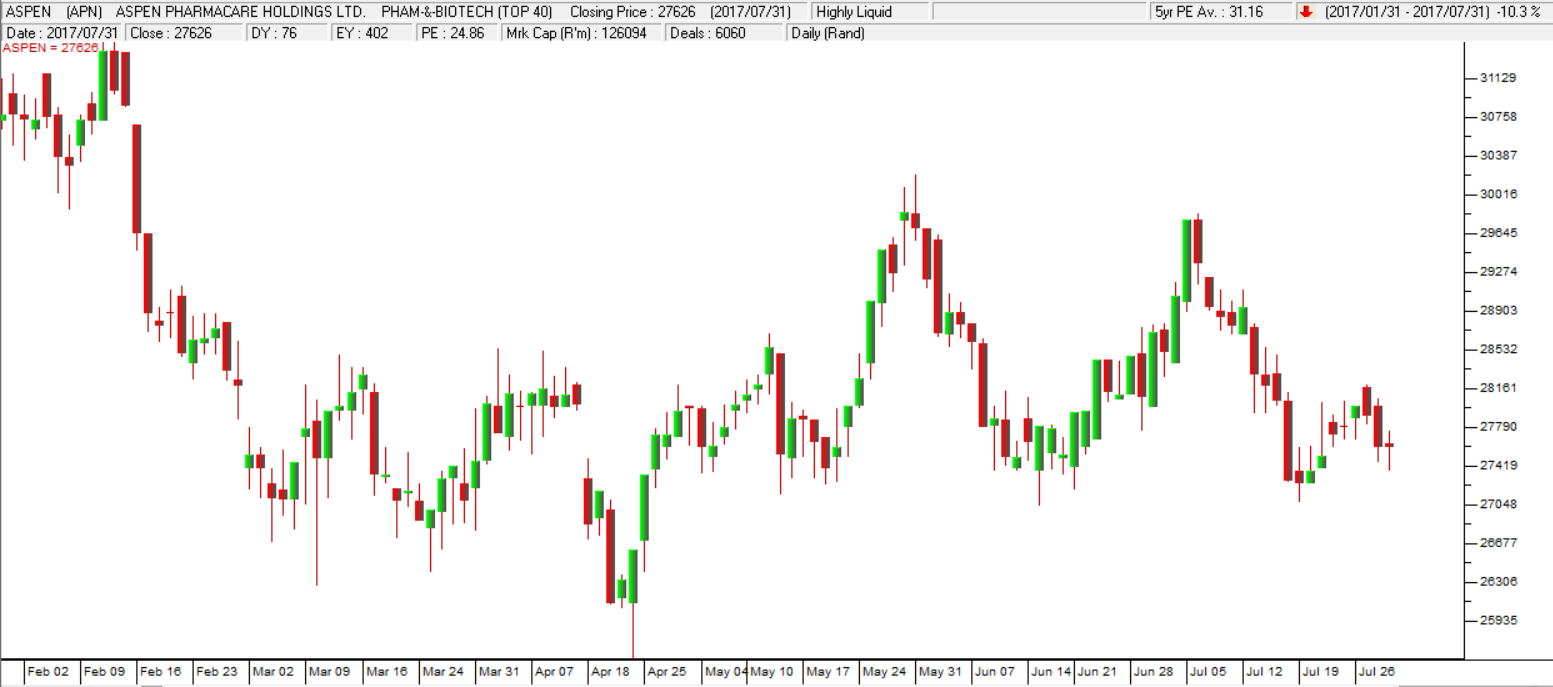
Aspen (ASP) - Chart by ShareFriend Pro
HUGE (HUG)
The Huge Group has just acquired Conectnet and Sainet which offered them some interesting economies of scale. Huge has 14000 clients, while Conectnet has 30 000. This makes for some good cross-selling of products. Connectnet has also been very cash-generative, paying a dividend of R37m in 2016. Sainet made a profit of R7,6m in 2016 off a turnover of R35m. Technically, Huge has come off from its high of 975c in March 2017 and is currently trading at 800c, where it seems to be hitting some resistance.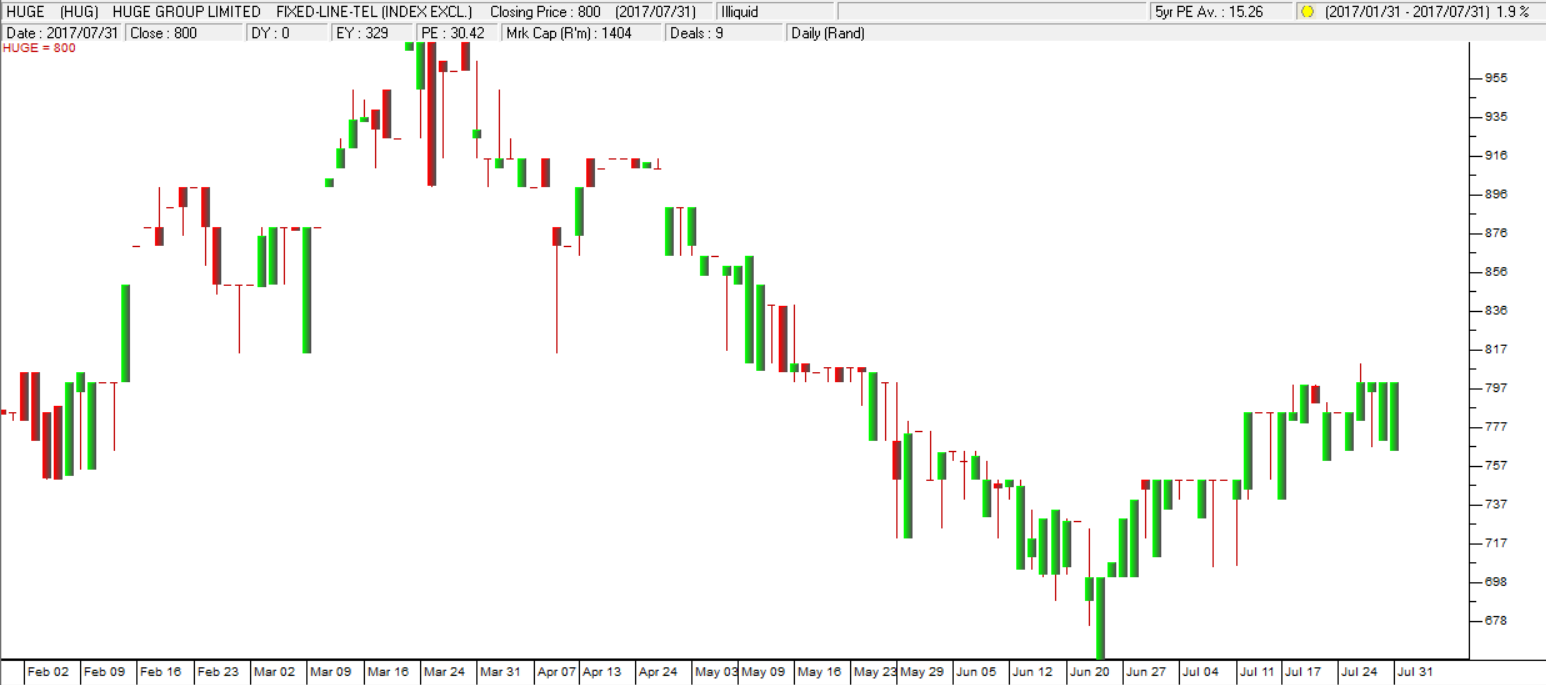
Huge (HUG) - Chart by ShareFriend Pro
CAPITEC (CPI)
Capitec Bank has been out-performing the banking index quite impressively this year. It has been adding about 100 000 new accounts every month and it claims that about 80% of these have been taken from other banks. The other big banks deny this and show either a slight gain in new accounts or no change. Nonetheless, the performance of Capitec has been dramatic and it is trading on a P:E of around 25 when the average P:E of the banking index is about 10,5. This means that investors rate it far more highly rated than the other banks. Its high P:E obviously reflects the strong growth in client accounts and its potential for adding additional products to market to that growing client base.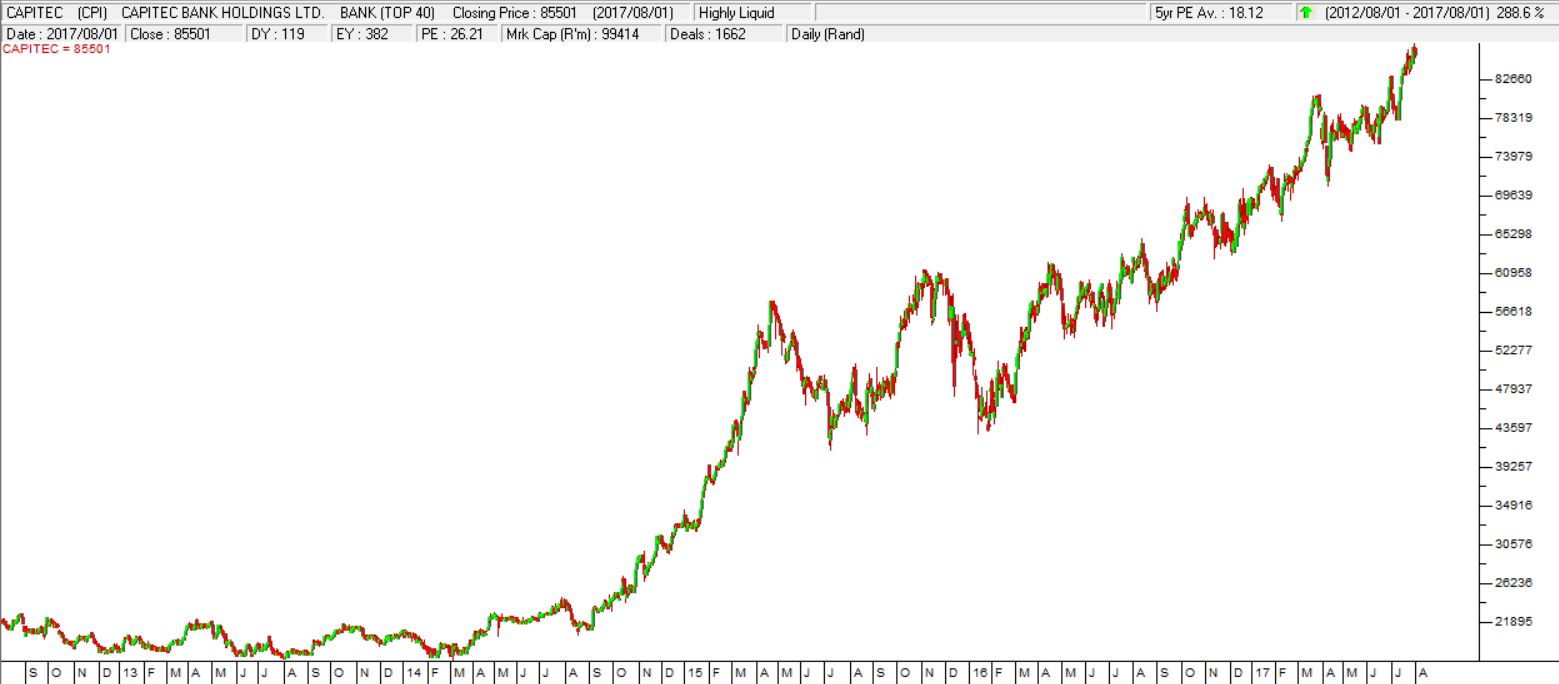
Capitec Bank (CPI) - Chart by ShareFriend Pro
WOOLIES (WHL)
Woolies is one of South Africa’s favourite retailers. It has a substantial investment in its overseas operations in the form of David Jones and Country Road. In South Africa, same store sales have been falling which is a clear indication of declining consumer spending. The share price has off-loaded heavily as institutions sold their holdings. In our view, this company, run by In Moir, is one of the bluest of blue chips. In time, as the South African economy recovers, this share will once again be an excellent part of any portfolio, and you are unlikely to see it at these low levels for very long.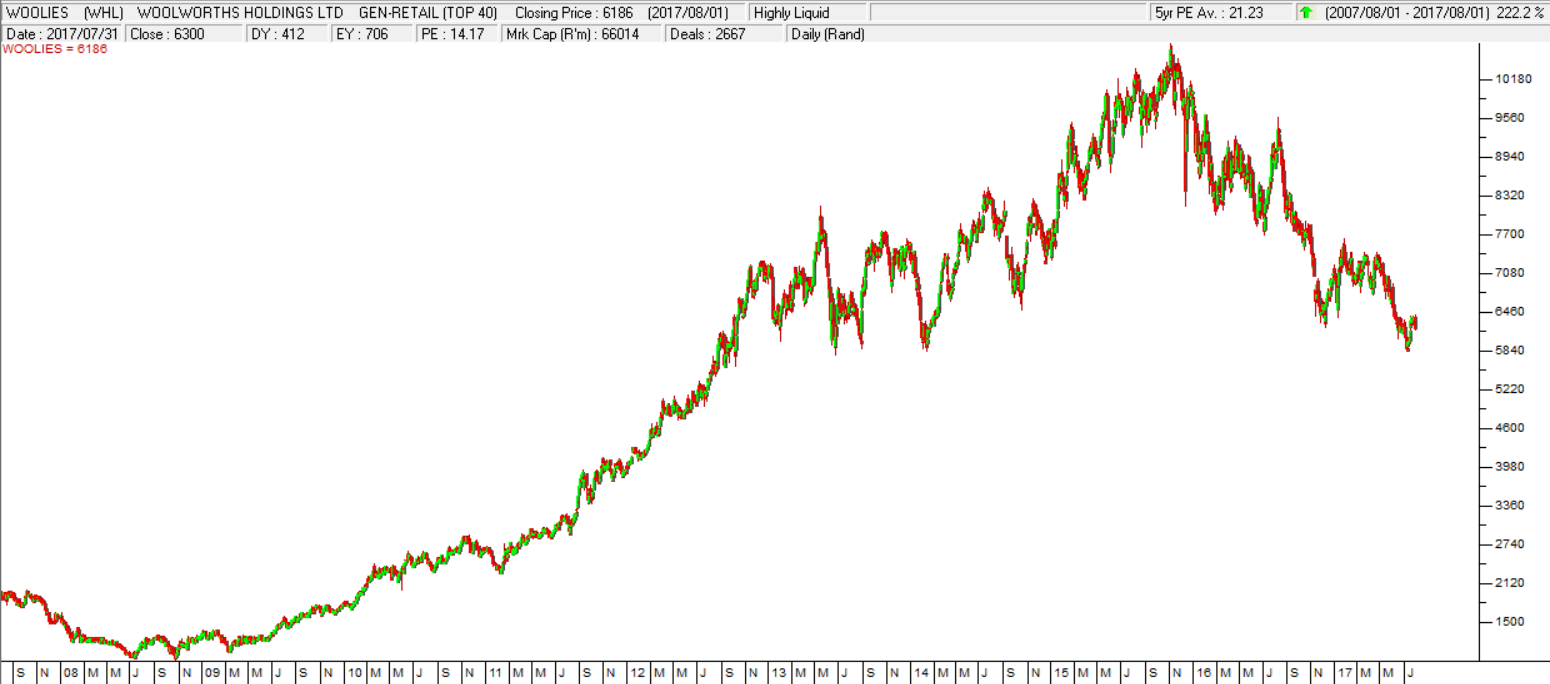
Woolworths Holdings (WHL) - Chart by ShareFriend Pro
ASTORIA (ARA)
Astoria is an investment holding company with a diverse range of overseas investments and 12,3% of its portfolio in Echo Polska Properties (EPP). Its current net asset value (NAV) is about R14.50, but the share is trading on the JSE for around R12. The investments it holds aside from EPP include Google, Facebook, Home Depot, Mastercard, Apple, Starbucks and Nike. EPP managed a return of 17% on a group of high-quality office and retail properties in Poland. At these low share prices, Astoria is busy buying back its own shares and spent R8m buying 720 000 of them in the year to end-June. We believe that this is an excellent rand-[glossary_exclude]hedge[/glossary_exclude] investment which will directly benefit from the rising equity markets of the world – and it is available at a discount to its NAV.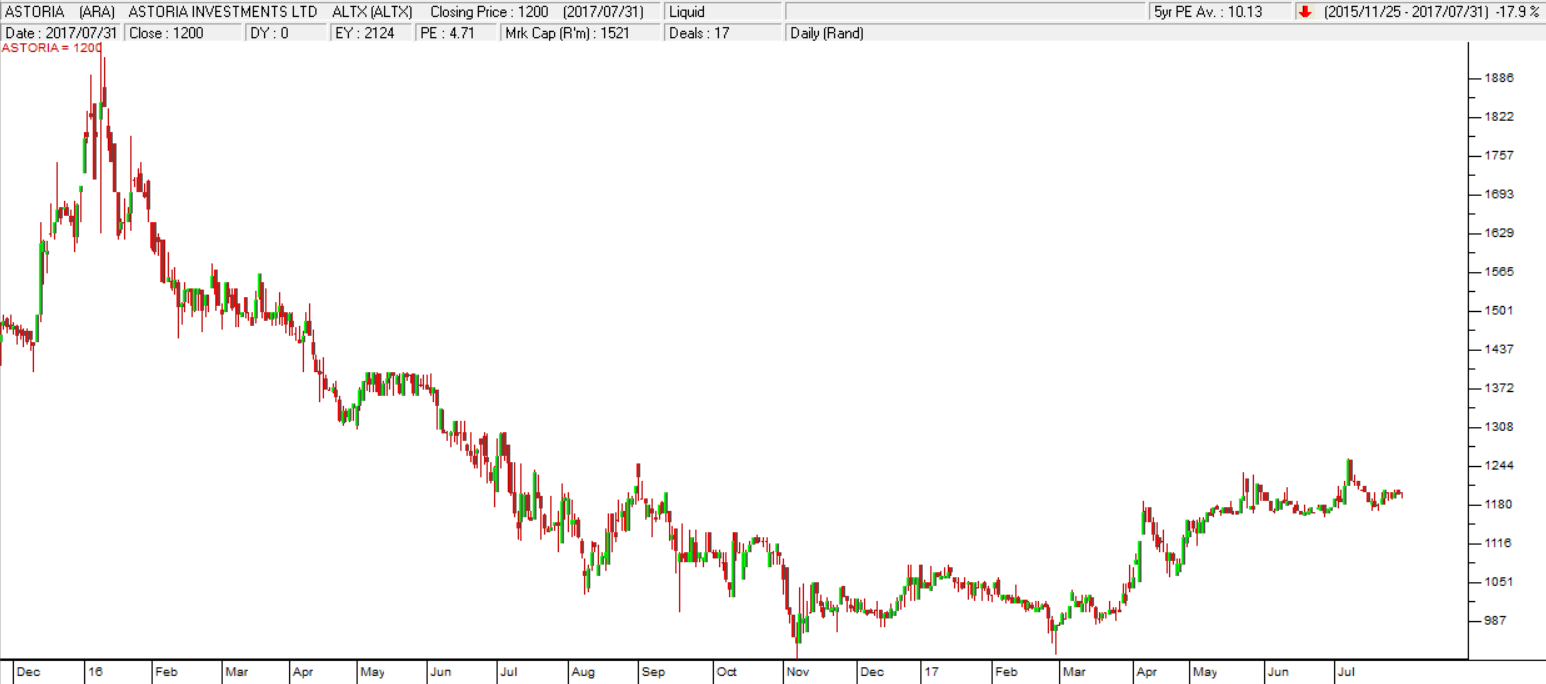
Astoria Investments (ARA) – Chart by ShareFriend Pro
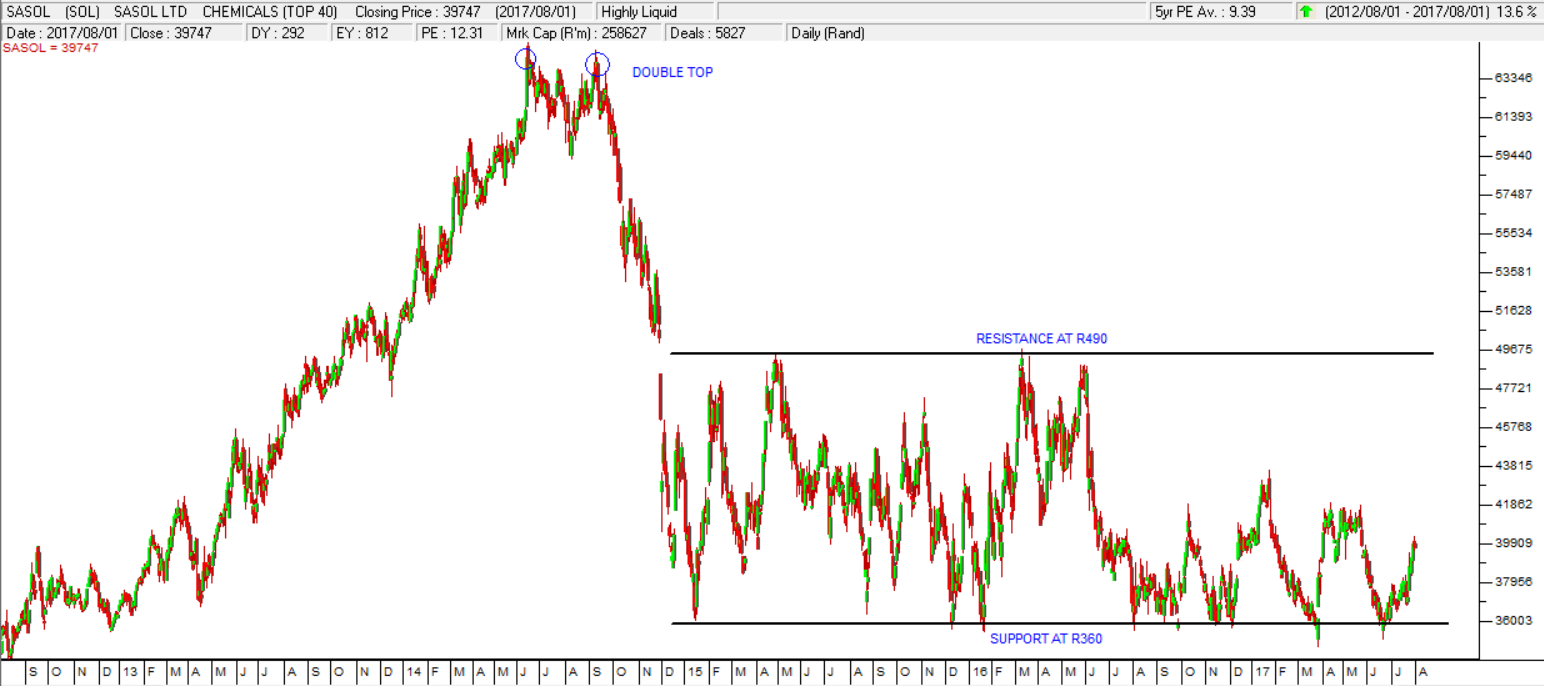
SASOL (SOL) Sasol is a company that produces both chemicals and oil products here in South Africa and overseas. About 60% of its income comes from oil products. It is also heavily influenced by the rand since most of its income now comes from outside South Africa. In 2014, the share was negatively impacted by the collapse of the oil price – and following a very clear double top formation at R640 it fell back to find support at R360. Since then it has been operating within a channel bounded by resistance at R490 and regularly testing support at R360. Consider the chart: