S&P Touches Record High
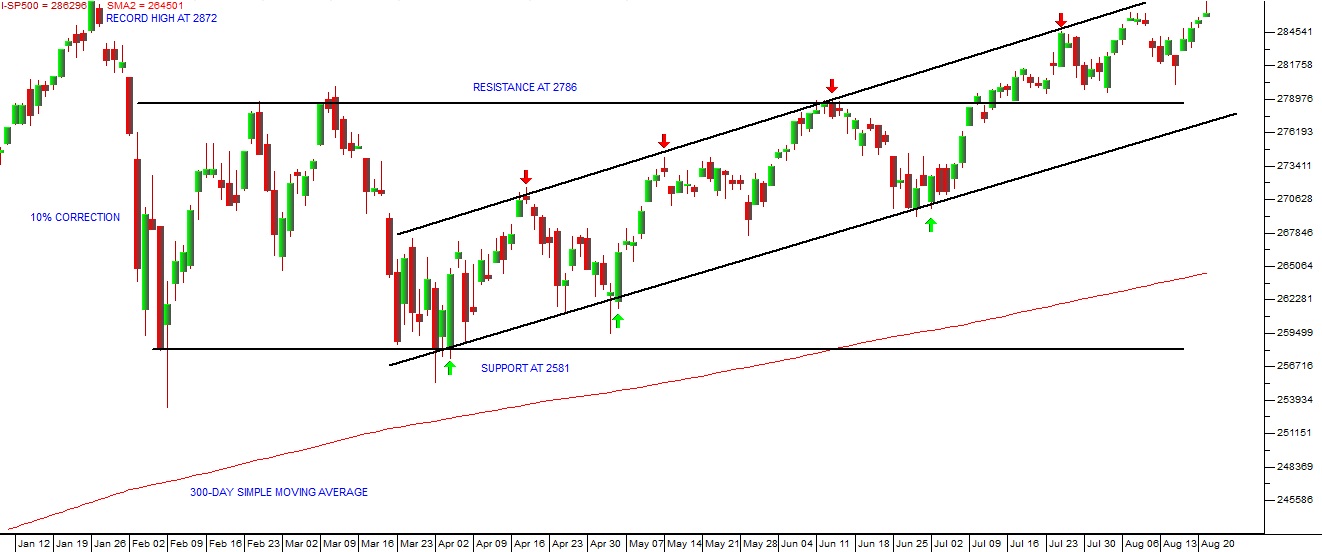
22 August 2018 By PDSNET9th of July 2018 and previously on the 6th of April 2018 we suggested in articles that the S&P had reached the bottom of its correction at 2581 and found strong support at the level. We also suggested that the strength of that support indicated that the correction had probably found its lowest point (2581) and would move up to break its all-time record high at 2872. Now the chart of this correction looks like this:
The 4th Correction

S&P500 Index January 2018 to August 2018 - Chart by ShareFriend Pro (Click to Enlarge Image)
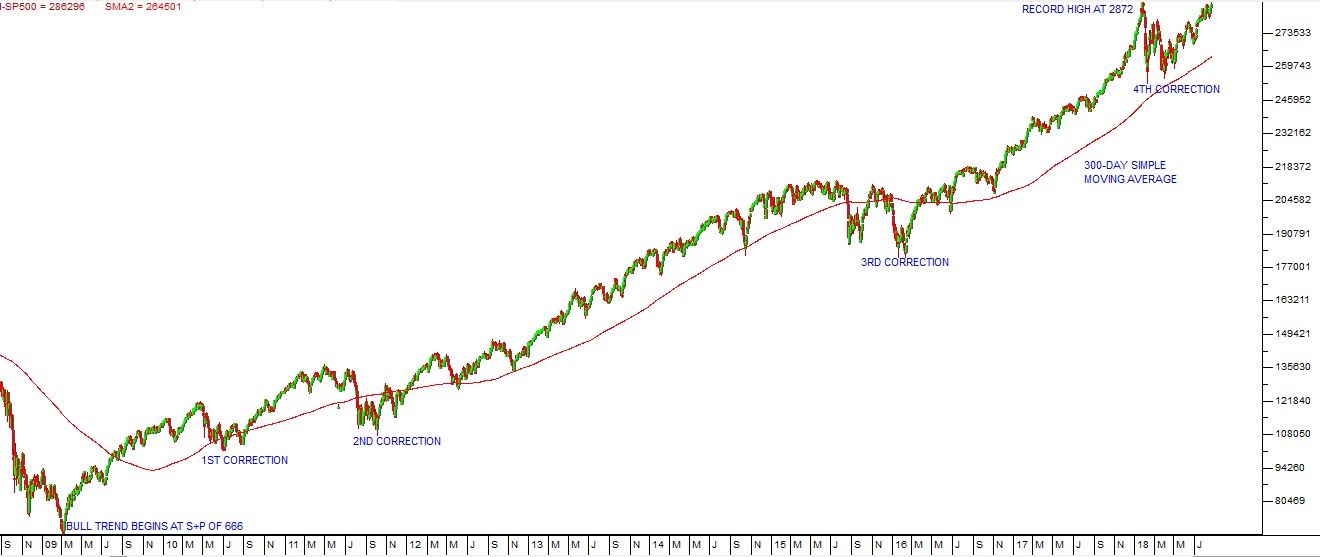
The upward sloping channel which began at the beginning of April 2018 has proved to be reliable and, as we have previously suggested, is having the effect of taking the S&P back up towards its all-time record high of 2872 made on 26-1-2018. Last night it actually touched that record level before falling back to close 20 points lower at 2862. This is typical of a previous high. There will always be some resistance at the level of a previous high. The bears will attempt to create a “double top”. However, in our opinion, it is highly likely that the S&P will break to a new record high in the next few trading days. Once a new record high is reached and the index closes convincingly above that level, the correction, which has lasted almost seven months, will end. This will signal a resumption of the great 9-year-old bull trend that began in March 2009. Consider the chart:The Great Bull Trend
