Using the OB/OS with Gold
17 August 2017 By PDSNETThe price of gold is set overseas, specifically by the two London fixings each day and the international spot markets. In South Africa, our gold shares have to contend with a volatile gold price as well as all the problems of mining in this country � strike action, uncertain legislation, faulting, friability of rock, deep level mining etc.. The combination makes them extremely volatile and risky. It is very difficult to know or find out what the important factors are for any particular mining [glossary_exclude]group[/glossary_exclude], especially if you have little or no expertise in mining.
For these reasons, the best strategy is to focus on technical analysis and look for specific signals which may indicate that gold [glossary_exclude]shares[/glossary_exclude] generally or a specific gold [glossary_exclude]share[/glossary_exclude] is oversold. In our opinion, the best mechanism is the Overbought/Oversold (OB/OS) indicator in ShareFriend. This indicator shows the extent to which shareholders have over-reacted historically both on the upside and the downside. Consider the following chart:
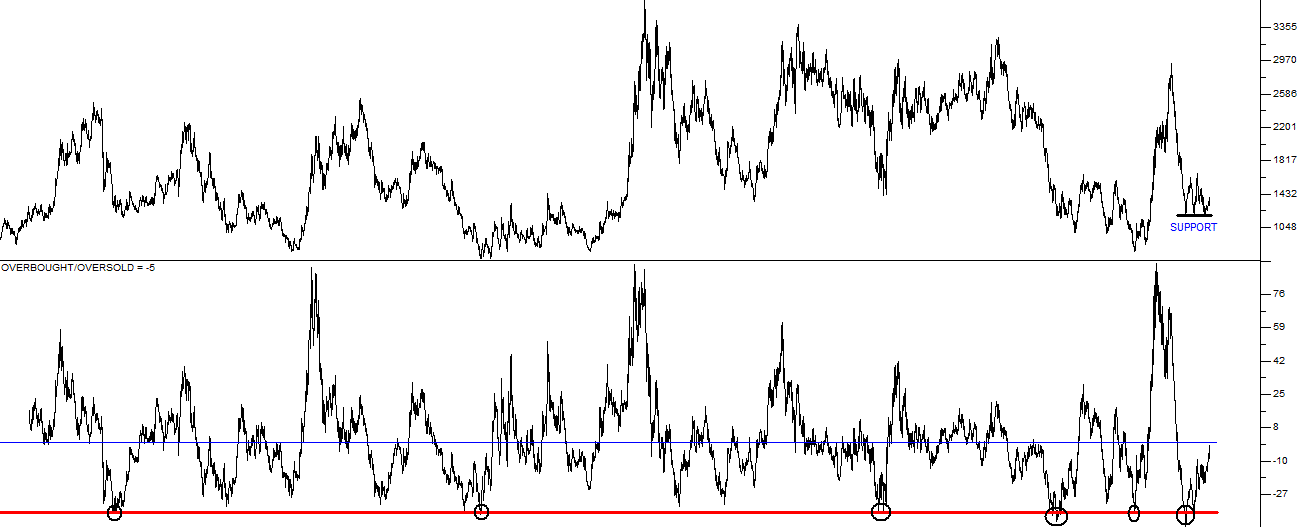
JSE Gold Index over last 32 years with 200 day OB/OS Indicator applied - Chart by ShareFriend Pro
Here you can see that we have divided the screen into to two charts. The upper chart shows the JSE gold index over the past 32 years. Recently, in the past nine months, the gold [glossary_exclude]index[/glossary_exclude] has made three bottoms at around 1180, indicating [glossary_exclude]clear[/glossary_exclude] support at that level. The lower chart shows a 200-day OB/OS. This indicator is interesting because it enables the technical analyst to determine a share/index�s propensity to over-react. In the case of the JSE gold index, the propensity of investors to over-react is more � probably because of the volatile and unpredictable nature of the market. Studying the history of the OB/OS on the gold [glossary_exclude]index[/glossary_exclude], you can see that it occasionally reaches an oversold level of minus 35 (the horizontal red line). In fact, it has touched or gone below this level on just six occasions (the black circles) over the past 32 years � and on each of those occasions, the JSE gold index represented a good buying opportunity.� The index is still very [glossary_exclude]close[/glossary_exclude] to the level it reached at the most recent of these signals and so, statistically, it seems probable that it is still over-sold and due for an upward move. You may also notice, looking at the lower chart, that the OB/OS very seldom goes up to a peak level above plus 65. In fact, it has done that only on 3 occasions during the last 32 years. Looking at this chart it might seem insane to think that someone actually was a buyer for gold shares at that extremely overbought level. But that must have been the case because otherwise the chart would not go to that level. The conclusion must be that if you buy gold shares at an oversold level of -35 or lower your probability of being wrong is extremely [glossary_exclude]low[/glossary_exclude] and you will at least have the satisfaction of knowing that you did a [glossary_exclude]lot[/glossary_exclude] better that the guy who bought at above +65! You must see that studying this [glossary_exclude]long[/glossary_exclude]-term chart of the OB/OS on the gold index significantly improves your probability of making money in the volatile and unpredictable gold market. Of course, the OB/OS can be applied to any chart and used in conjunction with other indicators.DISCLAIMER
All information and data contained within the PDSnet Articles is for informational purposes only. PDSnet makes no representations as to the accuracy, completeness, suitability, or validity, of any information, and shall not be liable for any errors, omissions, or any losses, injuries, or damages arising from its display or use. Information in the PDSnet Articles are based on the author’s opinion and experience and should not be considered professional financial investment advice. The ideas and strategies should never be used without first assessing your own personal and financial situation, or without consulting a financial professional. Thoughts and opinions will also change from time to time as more information is accumulated. PDSnet reserves the right to delete any comment or opinion for any reason.
Share this article: