The Creation of Money
The money supply of a country is a symbol of the goods and services of that country. Obviously, if the size of the money supply is increased more rapidly than the real growth of its economy, then you have more money chasing the same goods and services, resulting in rising prices. Since, over the long term, the only organisation that can create money is the government, this is in effect a form of taxation.
Aside from the government, banks and corporations can create money. Banks by lending out a precisely defined percentage of their deposits and corporations by issuing new shares. But ultimately, it is the government that decides the size of the money supply over the medium to long term. If they create new money and spend it, then the purchasing power of the currency in your pocket goes down over time – and that is a subtle and undisclosed form of taxation.
The idea is not a new one. The Romans periodically called in all the gold coins in the realm, ostensibly to have them re-minted with the image of the latest Caesar to come to power. Careful records were kept of all the gold coins handed in. Then they were melted down and 20% of lead added before they were reminted. Once the new coins had been handed back to the public, the authorities were left with 20% in the bottom of the pot. That was then used to finance the next Punic War. In those days they called it debasement and today we call it inflation – but it is essentially the same thing.
Elon Musk has been investigating the US Treasury and has discovered, to his surprise and amazement, that they have the ability to create money. Of course, he is an engineer and has very little understanding of National Accounting or of how government finances work. Had he done economics one at university, Musk would know that almost all governments constantly adjust the amount of money in circulation through what are called Open Market Operations.
Open Market Operations consist of the government entering the bond market to either buy bonds if they want to increase the money supply or sell them if they want to reduce it. This is a completely normal activity and has the objective of “leaning against the wind”. In other words, cooling the economy when it gets too “hot” or stimulating it by injecting funds to get growth going.
Following the October 1987 crash, the Governor of the Federal Reserve Bank (the “Fed”) at the time, Alan Greenspan, suggested that the government compensate for the wipe-out of wealth on the stock market by injecting funds into the economy. America and the other members of the then G7 did this with the consequence that the stock market turned around six months later and made a new all-time record high just 18 months later.
So successful was this strategy that Greenspan and all subsequent Fed Governors have adopted the same approach whenever the stock market collapsed. The problem was that each time they did it, the quantity of funds that needed to be injected increased. Following the 2007/08 sub-prime crisis, the government literally did not have sufficient funds to turn the economy and the stock market around. To overcome this problem, they adopted a policy of extensive “quantitative easing” (Q/E) where they simply created money and injected it into the economy.
Between 2007 and 2010 the largest economies in the world printed and injected at least $12,5 trillion into the world economy in their efforts to get it going again – and once again it worked – but only just.
Slowly at first, but with increasing rapidity, the world economy began to recover – along with their stock markets. The legacy of this approach has been that Reserve Bank balance sheets around the world, and especially in the US, ballooned to an enormous size.
Eventually, it was decided to reduce the size of the Fed’s balance sheet slowly through a reverse process that became known as quantitative tightening (Q/T). Just as this was beginning, the COVID-19 pandemic hit taking the economies of the world into a tailspin, with the result that Reserve Banks were once again forced to create and inject even more cash.
The US dollar is used in more than 60% of all international trade and, as a consequence, is held by most Reserve Banks as a reserve currency. Some countries even use the US dollar as their national currency rather than produce their own. This means that while the printing and injecting of new US dollars into the world economy did have some inflationary impact, it has been quickly brought under control by the latest round of interest rate increases.
The Fed’s balancing act of controlling inflation while stimulating growth is an on-going process which involves constantly adjusting the money supply through open market operations and both Q/E and Q/T. So, the “magic money machines” which Elon Musk discovered in the Treasury and its ability to create money comes as no surprise to economists and it is not sinister. Indeed, it is a critical element of the Fed’s management of the nation’s money supply.
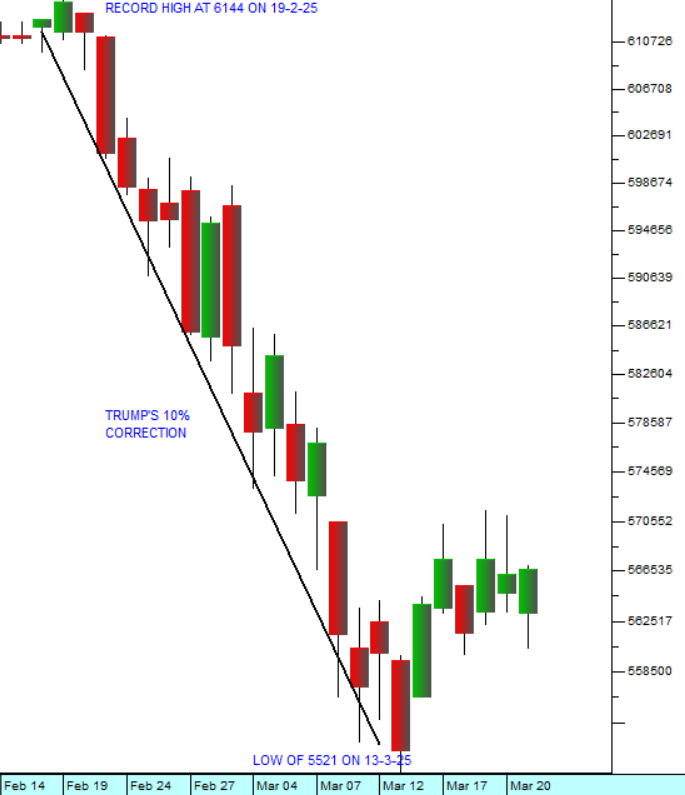
Footnote: On the 21st of February 2025 we tweeted that a break below the 6090 level on the S&P500 index would signal the start of a correction. Later, on the same day, the market broke down through that level and the “Trump correction” began. So far that correction has taken the market down 10% as investors battled to discount the effect of Trump’s on-again, off-again tariffs. On 11th March 2025 we tweeted:
“Despite what #Trump is saying, we are not seeing any clear evidence that the #USeconomy is in #recession. In our view, this #correction is probably close to its end and the current levels of the #SP500 (5550)therefore now represent a #buyingopportunity. The #bull remains”.
Since then, the market has been stable and climbing from an oversold position. In our view, Trump’s impact on markets may be waning. He has recently said that the tariffs are flexible indicating that he may be re-thinking the wisdom of the trade war that he has initiated. Either way, we believe that the bull trend remains in force and will ultimately continue with the S&P rising to further new record highs. Consider the chart:
← Back to Articles