The Collapse of the Dollar
8 December 2025 By PDSNETThe currency of a country is like the shares of a company. If a company is expected to do well and make profits, then its shares will rise and vice versa. The same is true of a currency. If the country’s economy is expected to do well and create strong growth, then its currency will appreciate against the currencies of other countries – and vice versa.
The problem is, of course, that because the US dollar (US$) is the dominant world currency, everything gets measured against it, so if the US$ itself is falling rapidly (as it is) then it becomes difficult and misleading to use it as a benchmark currency.
But what else can we use? We need a currency that holds its value through thick and thin - something that will retain its value despite tariff wars, and the various unpredictable exigencies of the modern world economy. There is only one reliable benchmark – gold.
Throughout history, gold has always retained its purchasing power. One ounce of gold today will buy you the same number of cattle or chickens that it would have bought you 5000 years ago in Egypt. The effective purchasing power of gold has never really changed much. Currencies may come and go, get stronger or weaker, but gold is the ultimate asset against which they can and must all be measured.
OIL
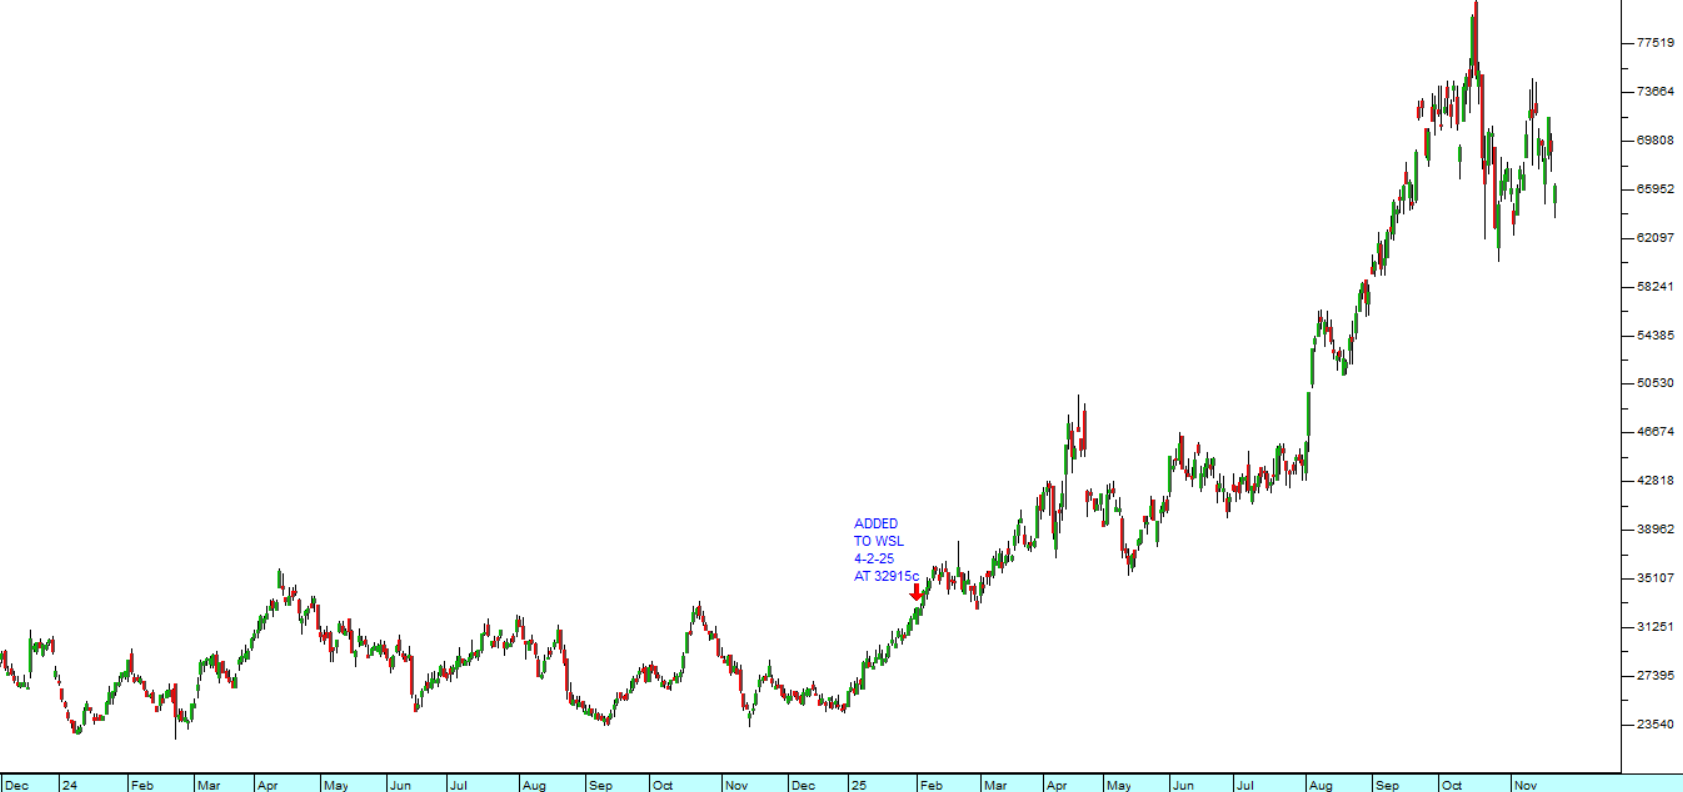
For example, we all know that the oil price has been falling. On the 8th of March 2022 one barrel of North Sea Brent oil would have cost you $125.95 and today that same barrel would cost you just $63.76c – a fall of almost 50% - but in US dollars. During the same time period the price of gold in US dollars went from $2056.82 to where it is today - $4214.74. In other words, against the benchmark of gold, the US$ lost 51.2% of its value. This means that the price of Brent oil, in terms of gold, has actually dropped by a whopping 71.7%. This perhaps explains Putin’s true dilemma. In terms of gold the value of Urals crude has almost disappeared completely.
BITCOIN
We can do the same exercise with Bitcoin over the same time period. On the 8th of March 2022, one Bitcoin was trading for $38 697.27 and today, despite its massive fall over the past two months, the same coin is worth $88538.48 – a gain of 128.8%. And the crypto bulls could take some comfort from that – until they adjust for the fall of the US dollar over the same time period. In terms of gold, one Bitcoin was worth 18.80 ounces of gold on the 8th of March 2022 and today it is worth 21 ounces – a gain of just 11.7%.
WALL STREET
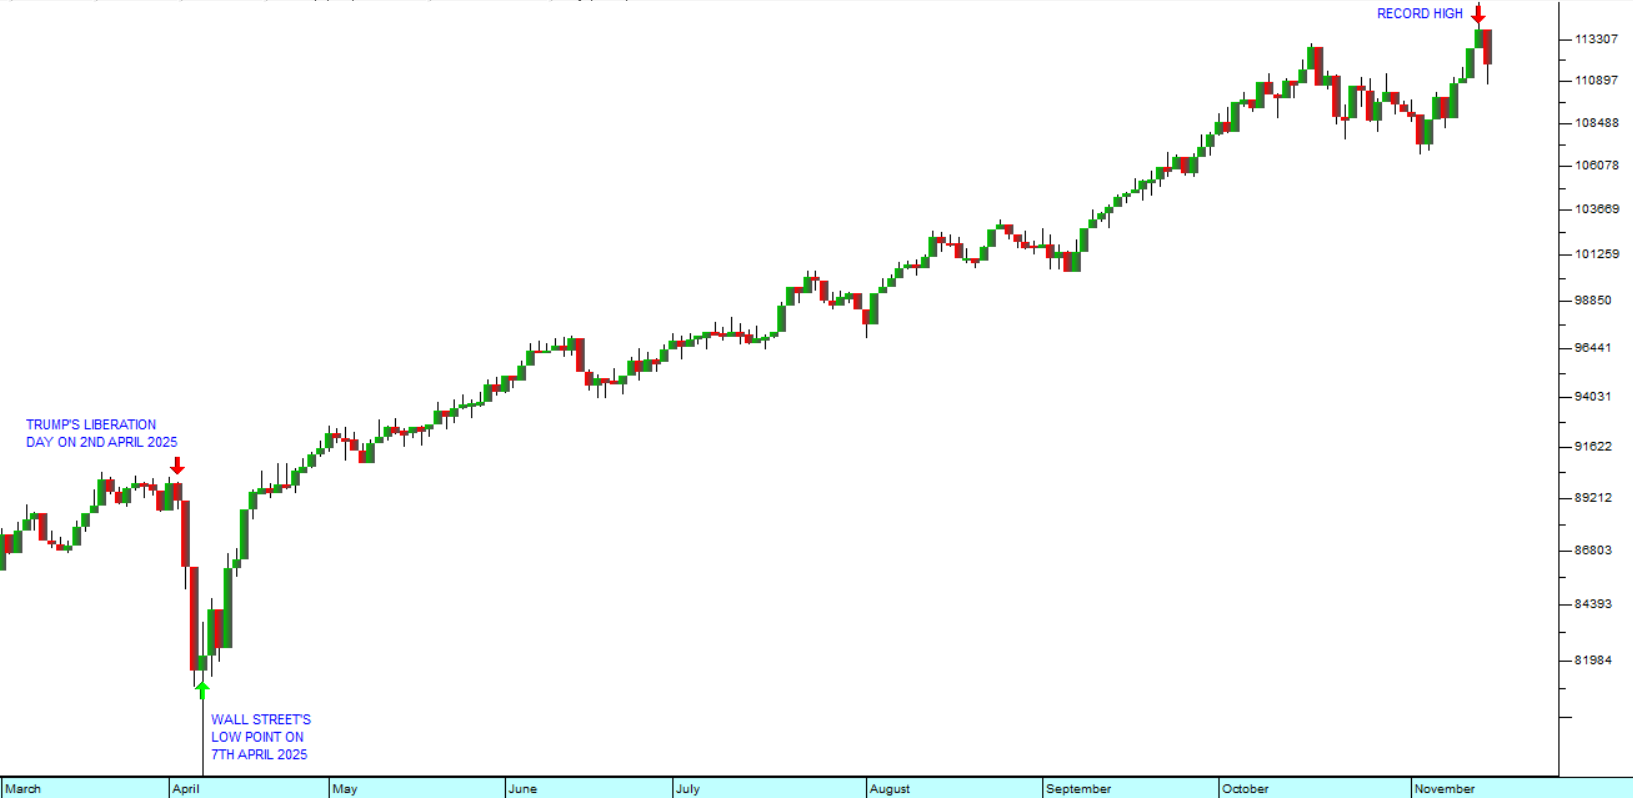
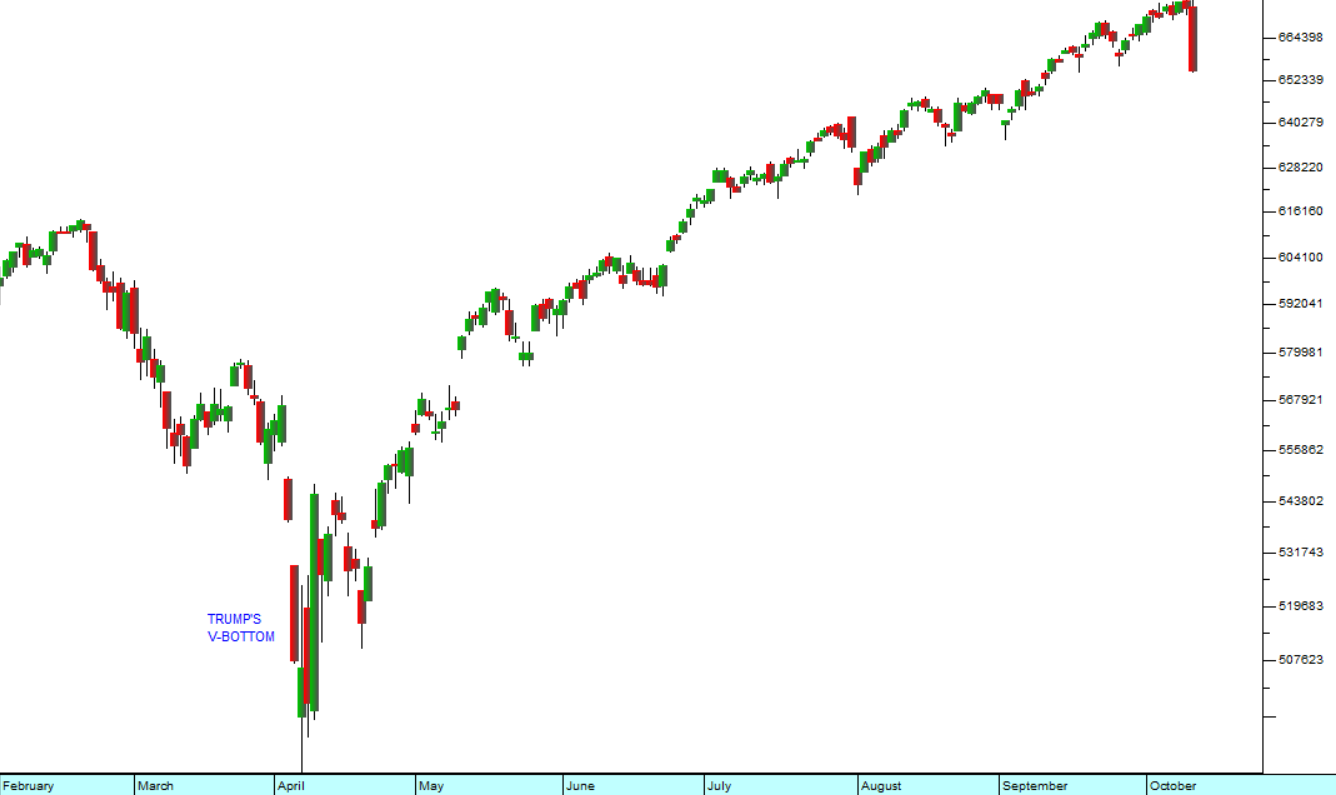
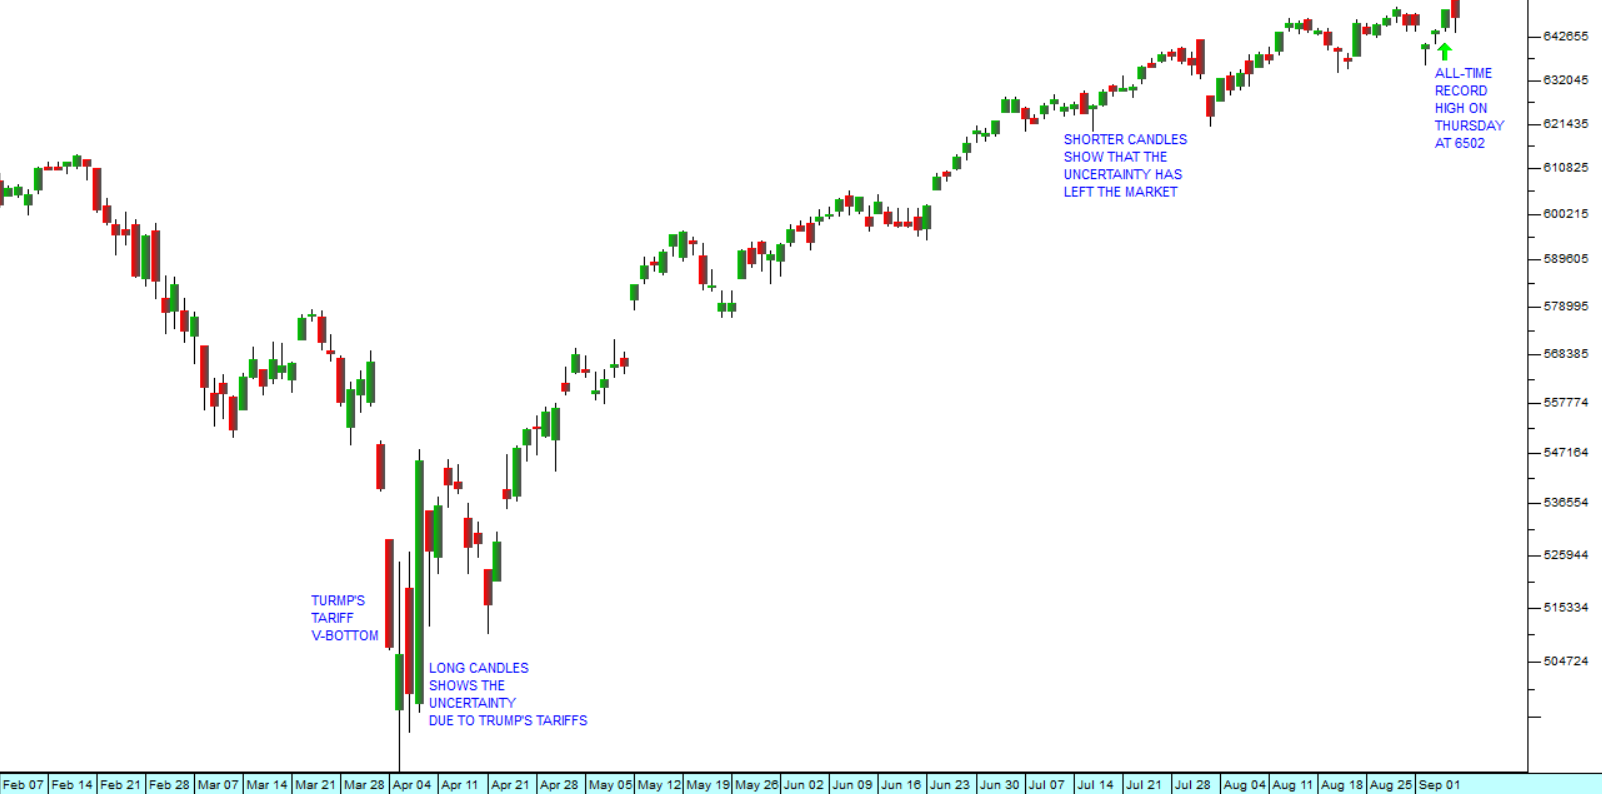
And what of the S&P500 index? We all know that Wall Street is in a primary bull trend and has been for 16 years. Beginning again on the 8th of March 2022, we see that the S&P closed on that day at 4170.7 and today it is at 6870.4 – a gain of 64.7%. But if we consider how much it has moved in terms of gold, we find that it is actually down 19.6% over that same time period. Consider the chart:
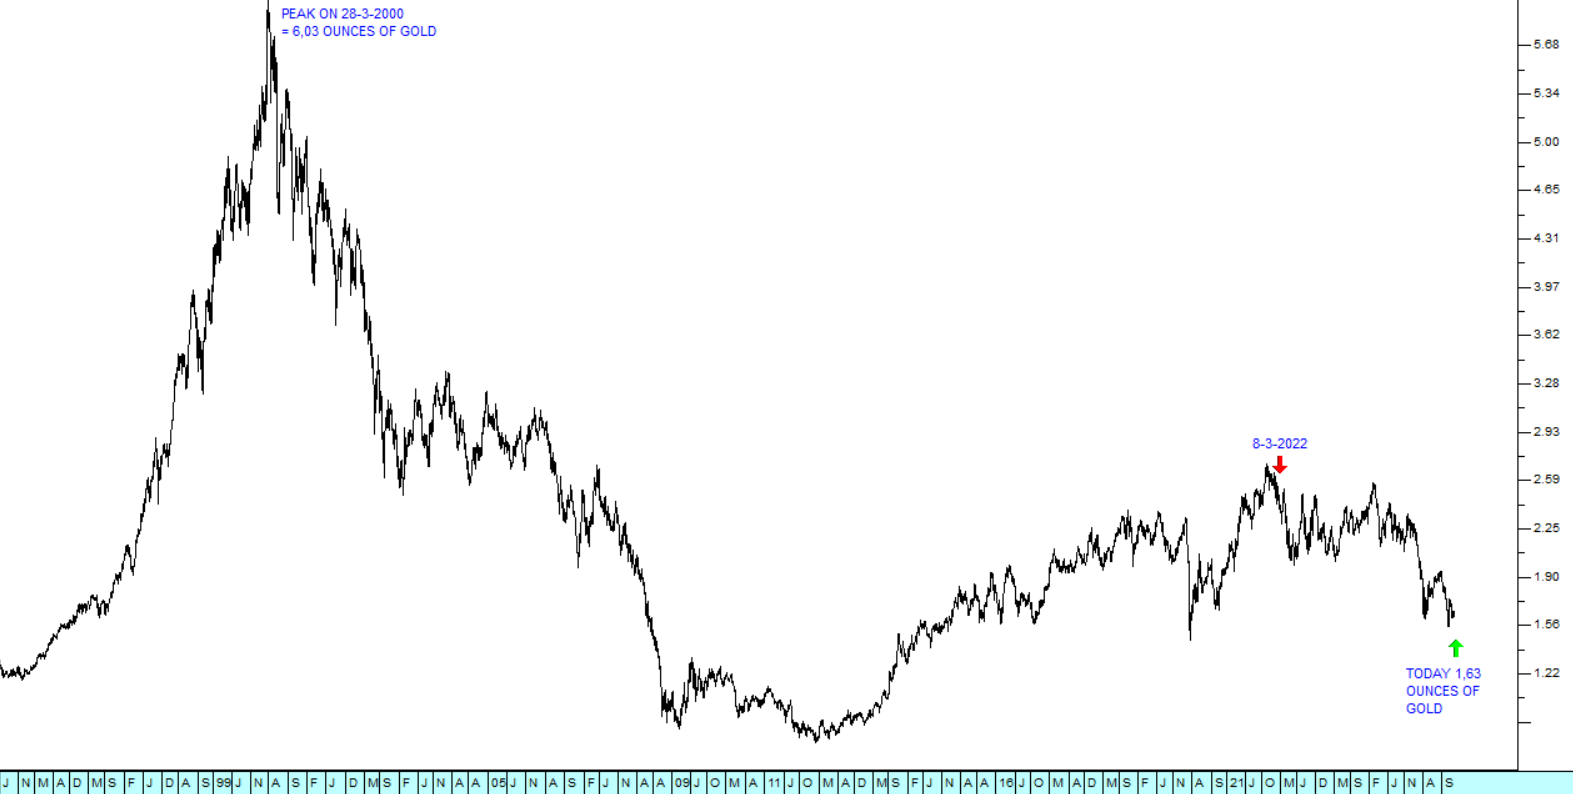
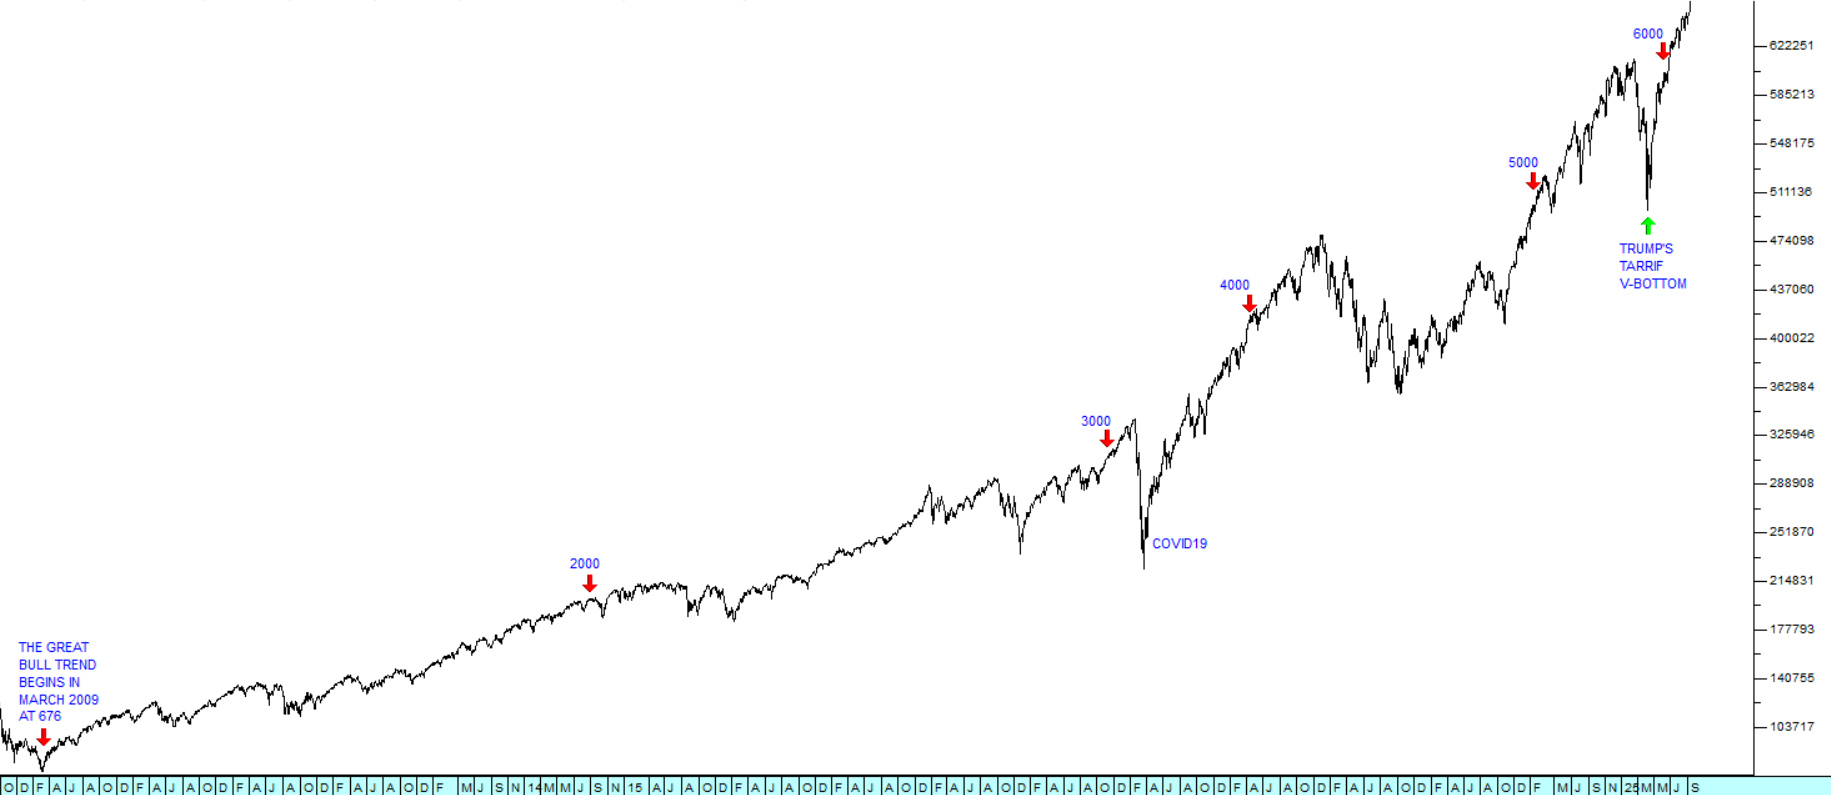
This is a comparative relative strength indicator (CRSI) chart of the S&P500 index divided by the US dollar price of gold. It shows that, in terms of gold, the S&P500 in fact peaked on the 28th of March 2000 at 6.03 ounces of gold - and that today it is trading for just 1.63 ounces – a 73% fall. The chart also shows that from the 8th of March 2022 it has been falling fairly steadily.
This type of analysis paints a very different picture from what we are used to - and one which you may find quite shocking. But of course, when you invest in the share market you buy and sell your shares for rands – and if you are successful, you make a profit in rands. The same applies to investors on Wall Street. Irrespective of what is happening to the value of the US dollar, their profits are still real in terms of the currency that they are using.
What you can learn from this is that gold is the constant. The gold price does not go up and down. Currencies, stock markets, bonds, cryptos and all paper investments go up and down against gold. The real value of gold hardly changes from one millennium to the next.
Since the beginning of this year, the United States dollar (US$) has been falling against the currencies of other countries indicating America’s general decline as the world’s leading economy and super-power. Since the beginning of the year alone, the US dollar has fallen 12.2% against the euro. On the 9th of April this year it took R19.93 to buy one US$. Today you can buy one for R16.96 – which means that the US$ has fallen almost 15% against the rand in just 8 months.
CRSI used in the chart above is a very simple indicator – it is calculated by dividing one data stream by another and then charting the result. You can use the CRSI to chart anything in terms of the gold price or to chart anything in terms of anything. It simply divides one data stream by another and then draws a graph of the result.
DISCLAIMER
All information and data contained within the PDSnet Articles is for informational purposes only. PDSnet makes no representations as to the accuracy, completeness, suitability, or validity, of any information, and shall not be liable for any errors, omissions, or any losses, injuries, or damages arising from its display or use. Information in the PDSnet Articles are based on the author’s opinion and experience and should not be considered professional financial investment advice. The ideas and strategies should never be used without first assessing your own personal and financial situation, or without consulting a financial professional. Thoughts and opinions will also change from time to time as more information is accumulated. PDSnet reserves the right to delete any comment or opinion for any reason.
Share this article: