The Cannabis Company
21 June 2020 By PDSNETUntil September last year, you could easily be forgiven for not paying much attention to the thinly traded penny stock, Labat. Styling itself as an “investment holding company” it seemed to have a diverse collection of businesses which did not hold much potential and lacked a clear focus.
In September 2019, however, it changed its focus and decided to become a “fully integrated cannabis business”. It was looking to cultivate, harvest, process and export cannabis from Lesotho for medicinal and pharmaceutical purposes.
It has acquired a collection of companies which make this new goal possible and give JSE investors the only listed company which is actively seeking to focus on and exploit the cannabis market.
On 14th April 2020 the company acquired 70% of Biodata, an East London based company which is focused on cannabinoid healing for pain management and insomnia. The acquisition was made for shares.
Nobody quite knows what the cannabis market will be worth in South Africa but the export potential for high-quality cannabinoids appears to be almost limitless. It is estimated that here in South Africa the market is perhaps worth about R27bn.
On 5th May 2020 the company issued a forecast of its future profits for the years ending 31st August 2021 and 2022 which they had produced as part of their road-show to raise funds from institutional investors. In those forecasts, they predicted that they would generate headline earnings per share (HEPS) of 10,9c in 2021 and 29,9c in 2022 – which is very impressive when its share price is just 46c.
Clearly, somebody believes these forecasts because the share’s price has suddenly jumped from around 30c to 46c in the last few days on very strong volumes traded.
In technical analysis, a rising share price which is accompanied by sharp increases in volume is an indication of insiders buying up the share. The “weak hands” are being bought out by the “strong hands”. Consider the chart:
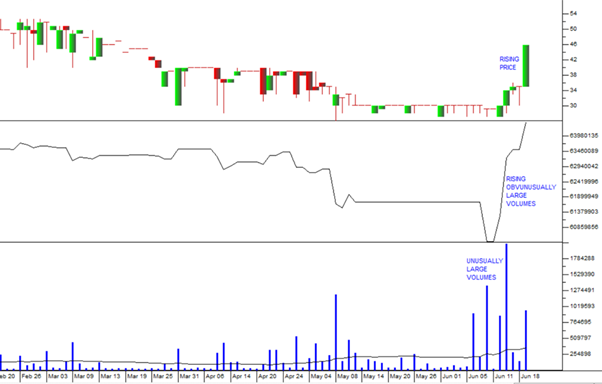
The top chart is a simple candlestick chart of the share’s daily price action, showing the sharp upward move. The middle chart shows it’s on balance volume (OBV) which is calculated by adding volumes to a running total on days when the share’s price rises and subtracting them on days when it falls. A sharp rise in the OBV is an indication that insiders are buying up all loosely held shares in the market. Finally, the bottom chart is a volume histogram which shows the daily volume of shares changing hands. This last chart shows how average volumes have increased sharply in the last week or so – and these volumes have been accompanied by a sharp rise in the share’s price.
All of this means that this share now represents an opportunity. Of course, there is risk, but there can be little doubt that cannabis is steadily becoming legalized throughout the world and the potential for its medicinal and leisure usage represents a huge opportunity. The increased volumes traded in the share now make it practical for private investors to buy.
DISCLAIMER
All information and data contained within the PDSnet Articles is for informational purposes only. PDSnet makes no representations as to the accuracy, completeness, suitability, or validity, of any information, and shall not be liable for any errors, omissions, or any losses, injuries, or damages arising from its display or use. Information in the PDSnet Articles are based on the author’s opinion and experience and should not be considered professional financial investment advice. The ideas and strategies should never be used without first assessing your own personal and financial situation, or without consulting a financial professional. Thoughts and opinions will also change from time to time as more information is accumulated. PDSnet reserves the right to delete any comment or opinion for any reason.
Share this article:

