S&P500 over 2600

27 November 2017 By PDSNET

The progress of the S&P500 index has been remarkable. On Friday, during the short Thanksgiving Day trading session it closed above 2600 for the first time ever. Investors have been buoyed up by the strong gains in corporate profits over the past few quarters and anticipate further good results in 2018. Consider the chart:

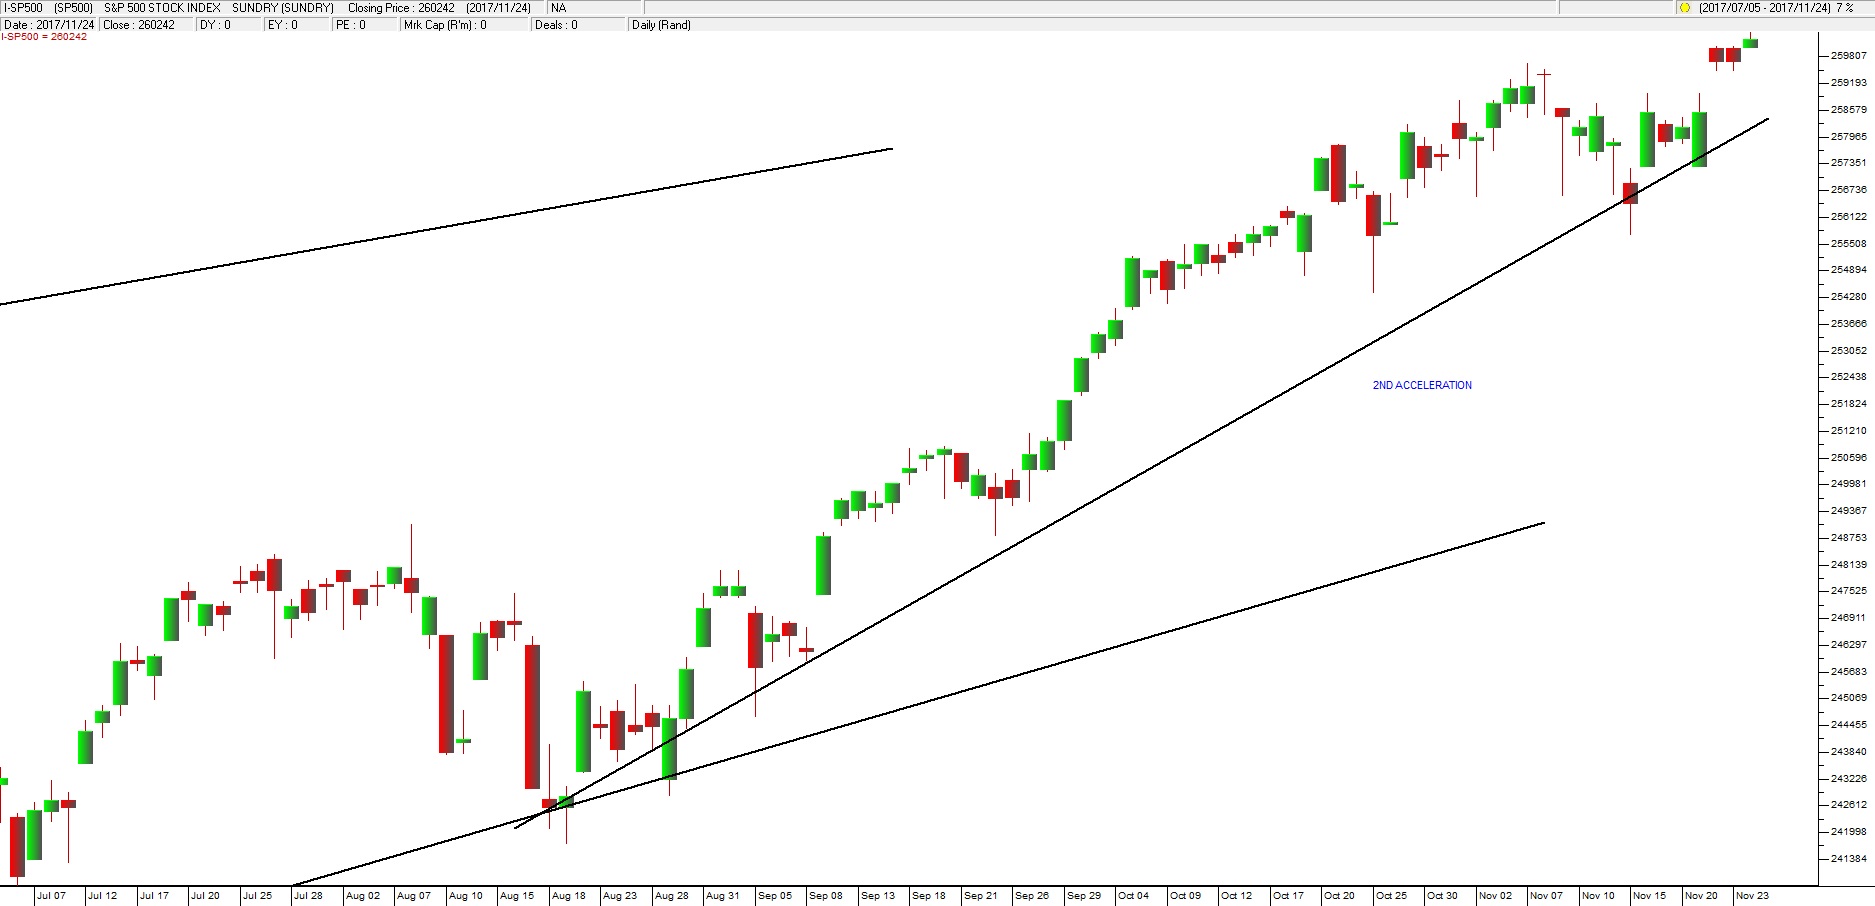
S&P500 Index June 2017 to November 2017 - Chart by ShareFriend Pro
(click to enlarge image)
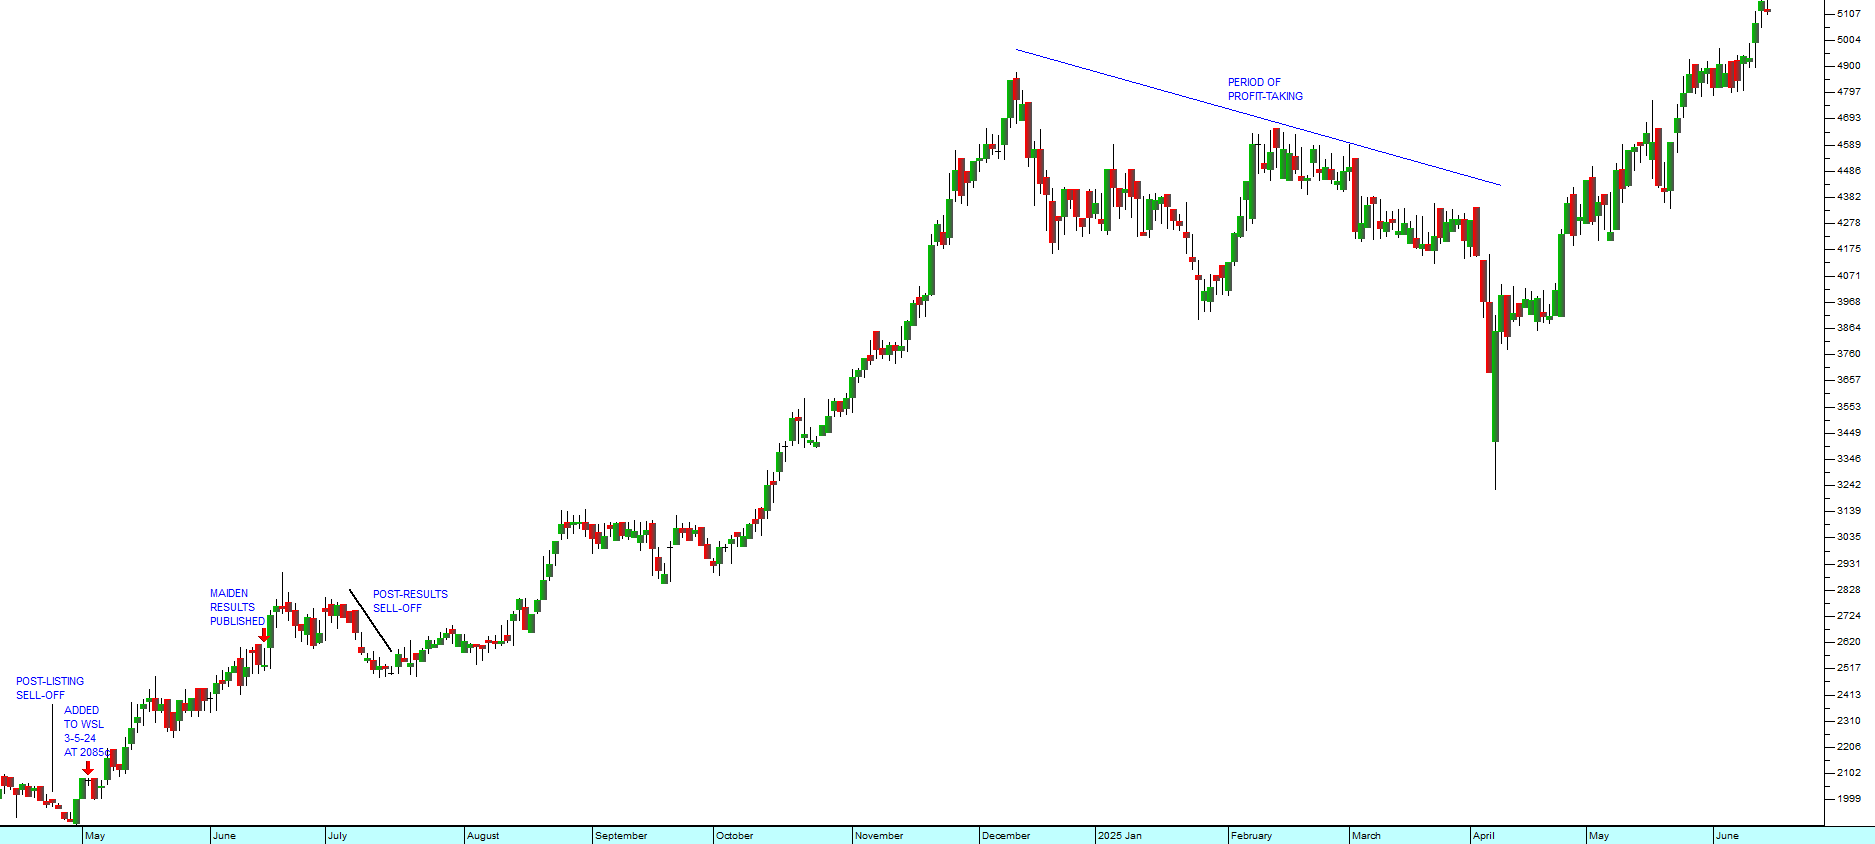
This chart shows the S&P over the past 5 months. The diagonal line across the top left-hand corner is the long-term upper channel line which we will consider in more detail below. As you can see the trend has accelerated since mid-August in what we describe as the 2nd acceleration. The meaning of this becomes clear in the second chart below:
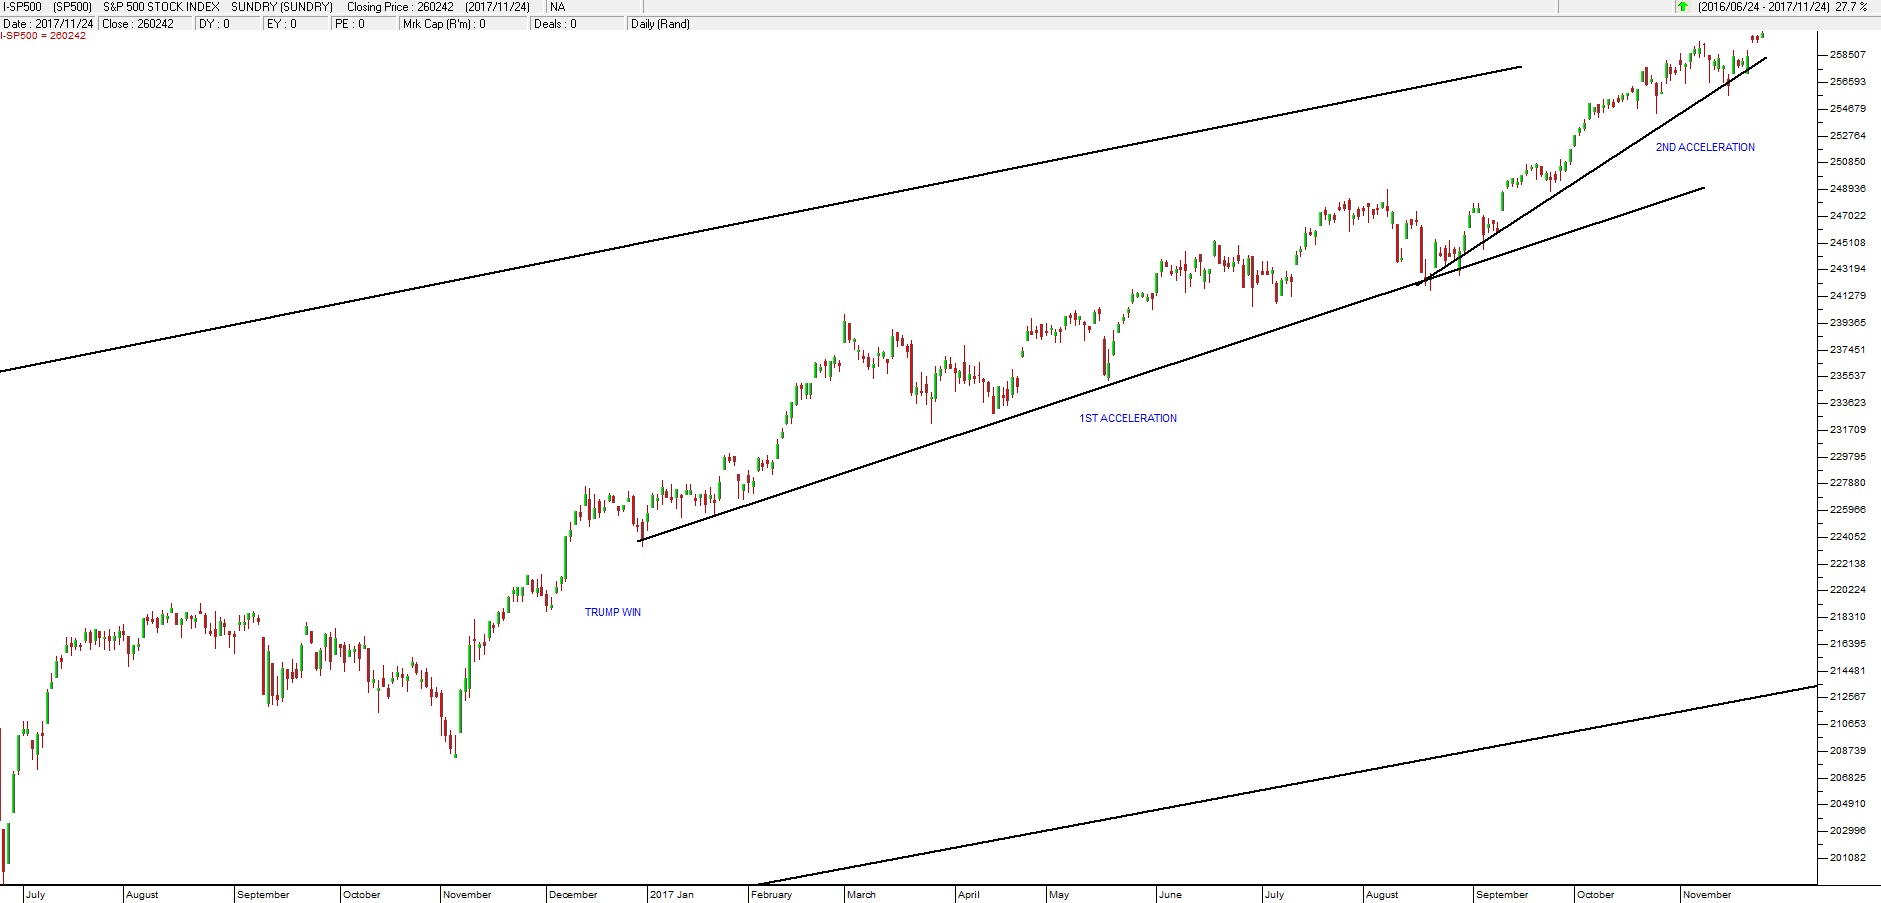
S&P500 Index July 2016 to November 2017 - Chart by ShareFriend Pro
(click to enlarge image)
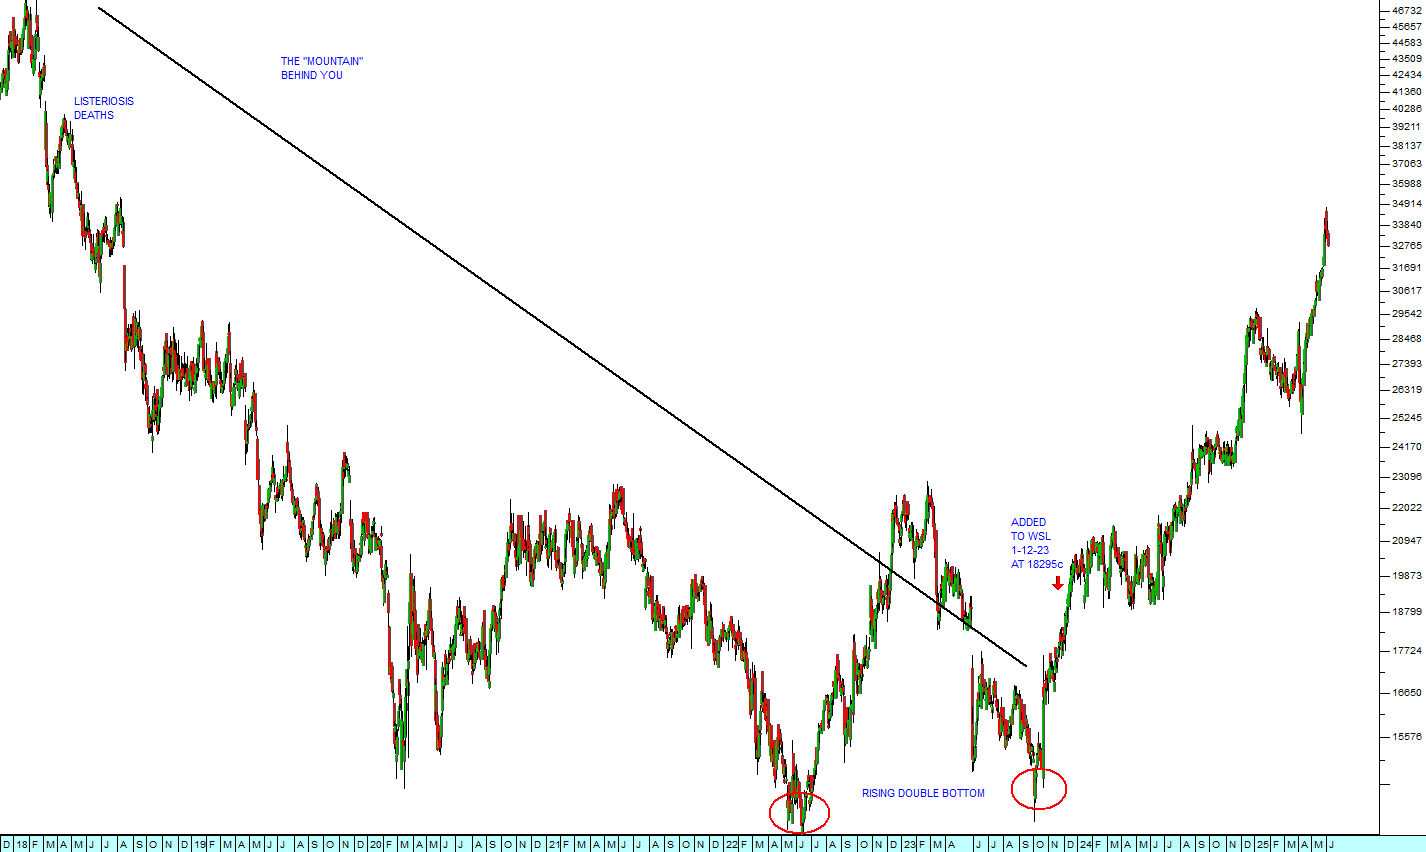
Here you can see the S&P over the past 22 months, since the second correction on 11-2-2016. Now the first acceleration which began in December 2016 becomes clear and it is possible to see the upper and lower long-term channel lines. We have also marked the win by Trump in November 2016. Finally, let us consider a chart of the entire bull trend since its commencement nearly a decade ago:
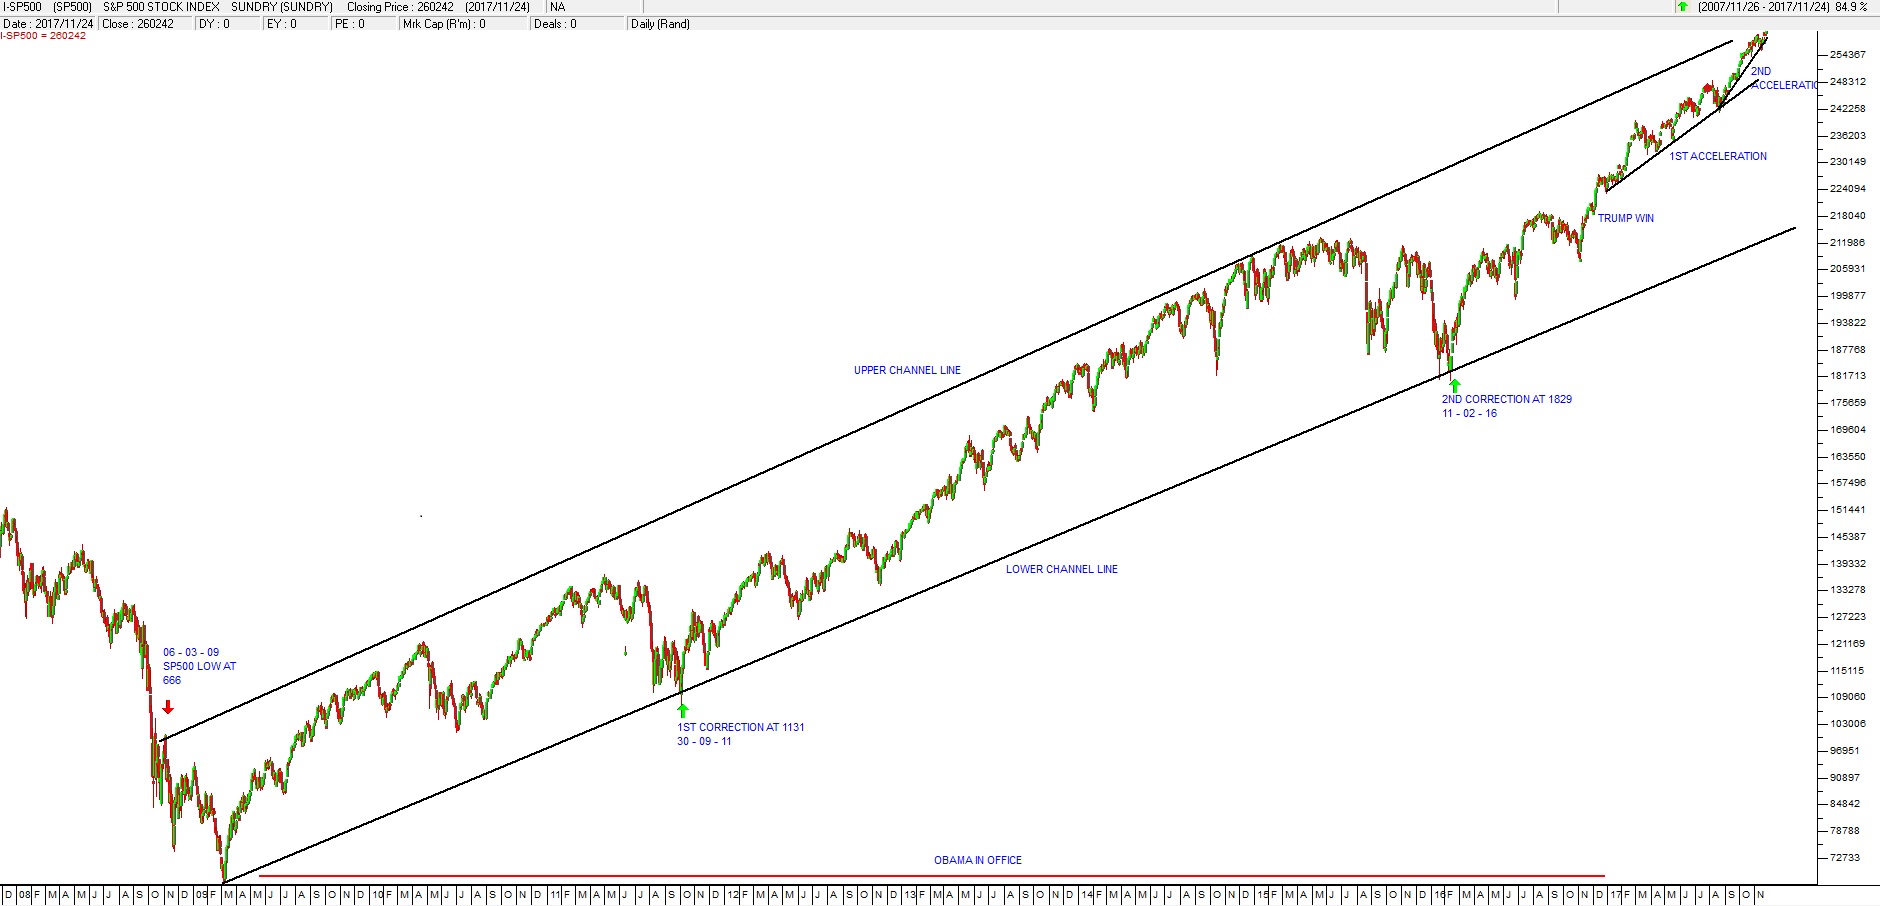
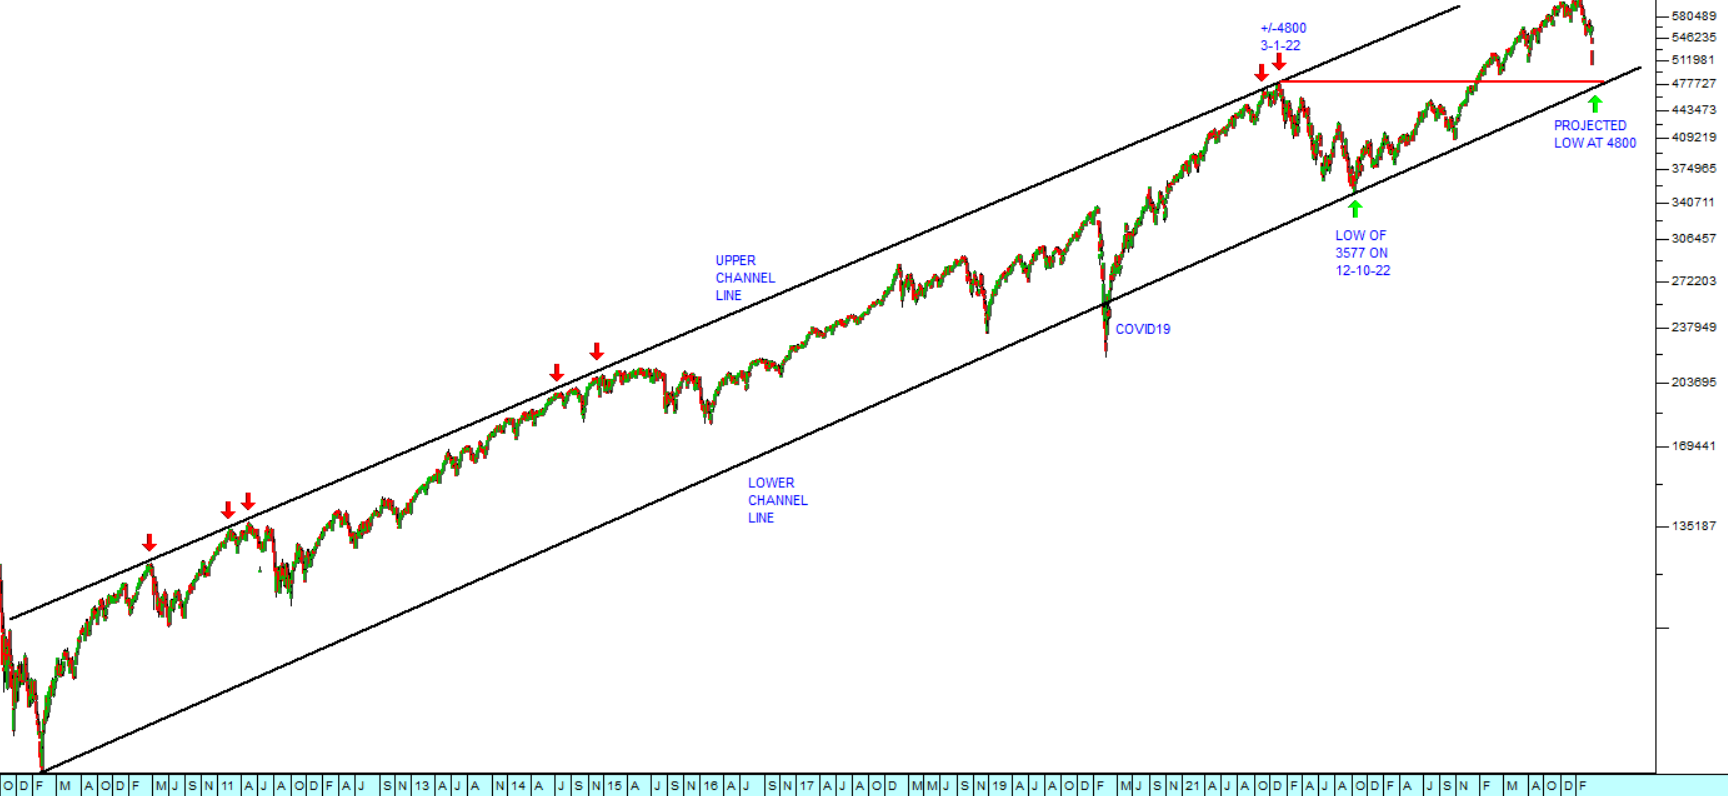
S&P500 Index 2008 to 2017 - Chart by ShareFriend Pro
(click to enlarge image)
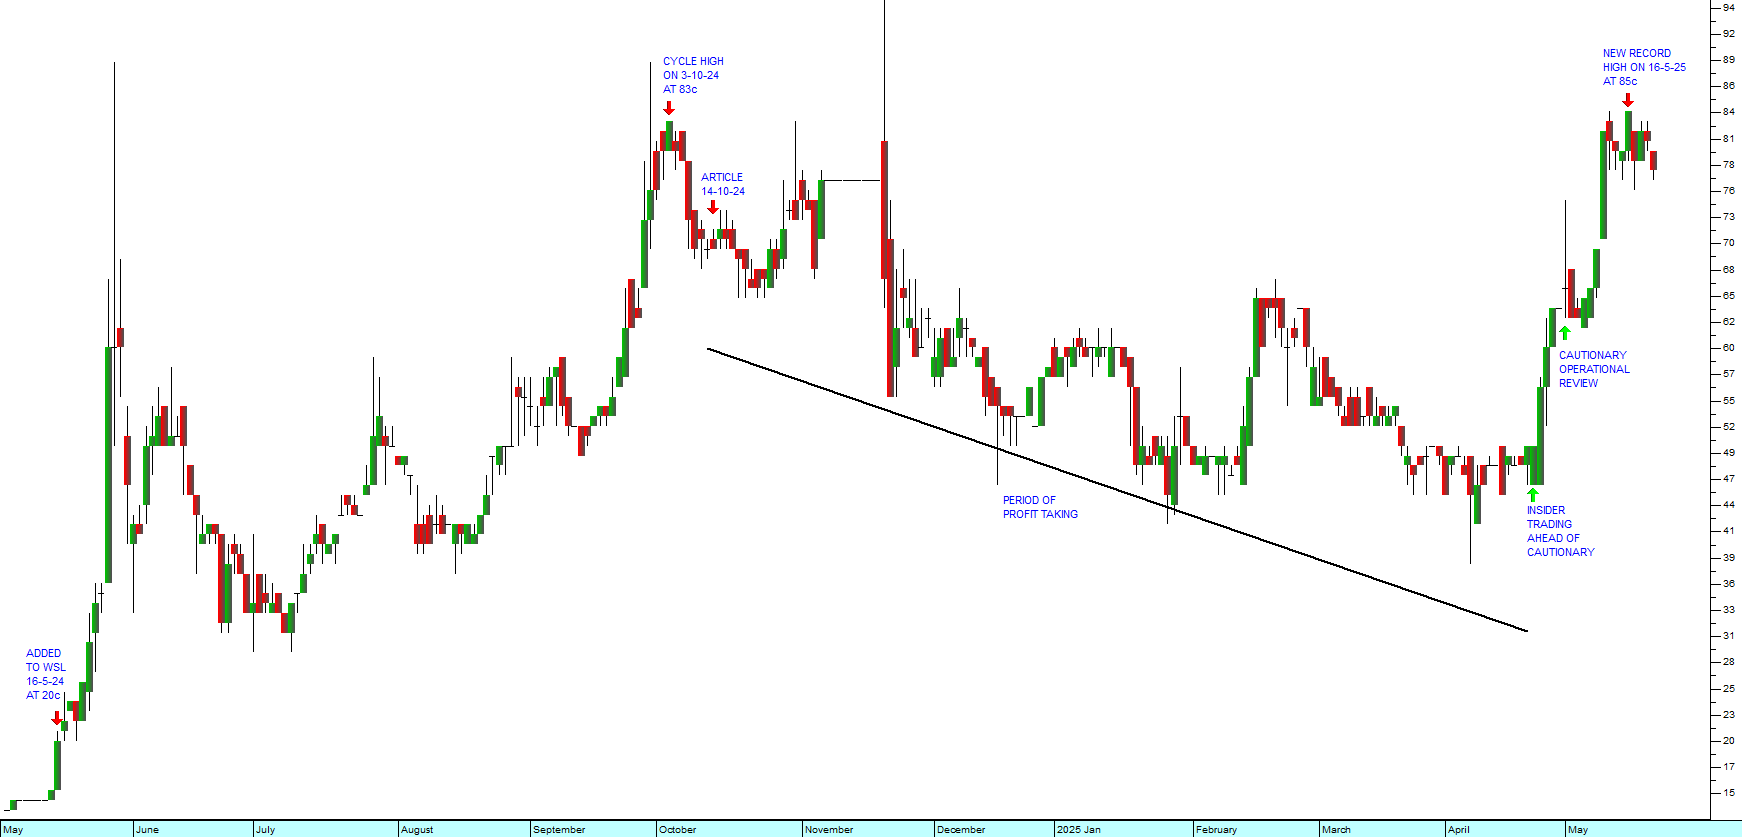
Now you can see the full context of the bull trend from its inception. It has been moving between clear upper and lower channel lines. You can see the two major corrections on 30-9-2011 and then again on 11-2-2016. At the bottom of the chart we have included a horizontal line (in red) that shows Obamas term of office and that indicates that this bull trend has little or nothing to do with Trump and his proposed tax reforms. The bull trend has been driven by three primary causes:
  1. The drop in energy prices since the middle of 2014 when the oil price collapsed. The decline in energy prices will almost certainly continue as renewable energy becomes more and more ubiquitous. We expect energy prices to ultimately fall substantially further over the next two decades.
  2. The massive amount of quantitative easing (printing of money) which accompanied the sub-prime crisis. It is estimated that a total of around $12,5 trillion was injected into the world economy and Europe is still printing and injecting 60 billion euros a month into the economy. All that money which has been sloshing around in the worlds financial system is now starting to be spent. As more and more money is spent it will drive markets even higher.
  3. The enormous efficiencies which are flowing from all the new disruptive technologies that are rapidly becoming part of the world economy. These efficiencies are driving a massive and sustained rise in productivity which is reflected in increased profits for all companies. The strong growth in the profits of the S&P500 companies is evidence of this and is pushing share prices up.
What is important is to understand that this bull trend is different from other bull trends since World War II in that it will almost certainly be exponential. It has already lasted for an inordinately long period of time and our belief is that it is far from over. In our opinion, we are in that part of the exponential chart where it turns from being more-or-less horizontal to being more-or-less vertical. At the moment there is still some connection between share prices and the profits of the underlying companies. As we enter the vertical part of this market that connection will be lost. The two recent accelerations which we have identified show that the rise is now gaining momentum. In time, investment experts and economists will become afraid to predict the top of this market. The bears, who are already hesitant, will be completely eliminated. We are seeing predictions for the S&P above 3000 and our view is that the S&P will go much higher in time. It is interesting to compare this bull market with that of the early 1900s leading up to the stock market crash of 1929. That too was driven by two important new technologies the mass-production of the motor vehicle and the spread of the telephone. The current situation is not dissimilar. Technologies from self-driving cars to rapidly improving photo-voltaics and the rapid spread of smart phones and high-speed internet are driving the world economy. The difference is the massive amount of new cash which has been injected into the world economy since 2008. That will provide the liquidity necessary for the economy to enter an unprecedented boom.


DISCLAIMER

All information and data contained within the PDSnet Articles is for informational purposes only. PDSnet makes no representations as to the accuracy, completeness, suitability, or validity, of any information, and shall not be liable for any errors, omissions, or any losses, injuries, or damages arising from its display or use. Information in the PDSnet Articles are based on the author’s opinion and experience and should not be considered professional financial investment advice. The ideas and strategies should never be used without first assessing your own personal and financial situation, or without consulting a financial professional. Thoughts and opinions will also change from time to time as more information is accumulated. PDSnet reserves the right to delete any comment or opinion for any reason.


Share this article:

PDSNET ARTICLES

The Debtors' Book

A BIT OF HISTORY

Many years ago, in 1982 when I started this business (which became “PDSnet”), I ran advertisements in both the Rand Daily Mail (RDM) and in the Star – which were the two most widely read newspapers in Johannesburg at the time. At that time, we were a very small business and had no credit rating at all. Despite this the RDM immediately

WeBuyCars - Results

The financial results of companies show how profitable they are and give a good indication of their share’s risk and potential return. WeBuyCars (WBC) is a recent listing which came to the JSE on the 11th of April 2024. Unlike other listed motor vehicle companies, it is a company which specialises in the purchase and sale

Choosing Winners

We are often asked how we go about selecting the shares to put on to the Winning Shares List (WSL). Right now, there are 102 shares on the list with 5 having gone down since they were added, 94 are up and 3 are unchanged. On an annualised basis, 24 of them are performing at above 100% per annum.   

As a private investor,

Kore Revisited

Kore (KP2) remains at once the most exciting and most risky investment on our Winning Shares List (WSL) at the moment. We originally added it to the list just over a year ago on 16th May 2024 at a price of 20c. It subsequently rose to a high of 83c on 3rd October 2024 and we published an article

Rand Strength 2025

The strength of the rand is both a critical and a complex issue for private investors on the JSE. Our currency is influenced by two primary forces:

  1. Our local economy’s prospects
  2. The rand’s role as a leading emerging market currency

These, in turn, are

Sibanye Revisited

In these uncertain times, when nobody really knows to what extent Trump will back down on the international trade war which he has initiated, many investors are moving into precious metals as a hedge against the weakness of paper currencies (especially the US dollar) and paper assets like equities and bonds.

The problem

Smart Local Investors

The last two months have been wild on the markets – mainly because of Trump’s ill-advised, on-again, off-again tariff policies. The issue now is:

Will this morph into a full-blown bear trend? Or is this correction almost over?

From his election victory on the 6th of November 2024,

Jerome Powell

The Federal Reserve Bank (“the Fed”) is completely outside the control of the President and Executive Branch of the US government. The chairman of the Fed is appointed for a renewable 4-year term by the President. The President cannot remove the Chair without cause. The current chairman, Jerome Powell was appointed by Trump during his first term as President and reappointed by

Uncertainty Soars

Investors are by their very nature risk takers, but they are always trying to reduce the risk which they have to take to a minimum. Donald Trump, with his threat of an international trade war and his on-again, off-again tariffs has significantly increased the level of risk in markets across the world. This can be seen in the extraordinary volatility in the S&P500

Liberation Day

Trump has done the unthinkable. He has deliberately engineered the collapse of the US and world stock markets in the nonsensical belief that somehow an international trade war will make Americans richer. Nothing could be further from the truth. His actions have taken the S&P down from its all-time record high of 6144.15 on 19th February 2025 to Friday’s