Smart Local Investors
29 April 2025 By PDSNETThe last two months have been wild on the markets – mainly because of Trump’s ill-advised, on-again, off-again tariff policies. The issue now is:
Will this morph into a full-blown bear trend? Or is this correction almost over?
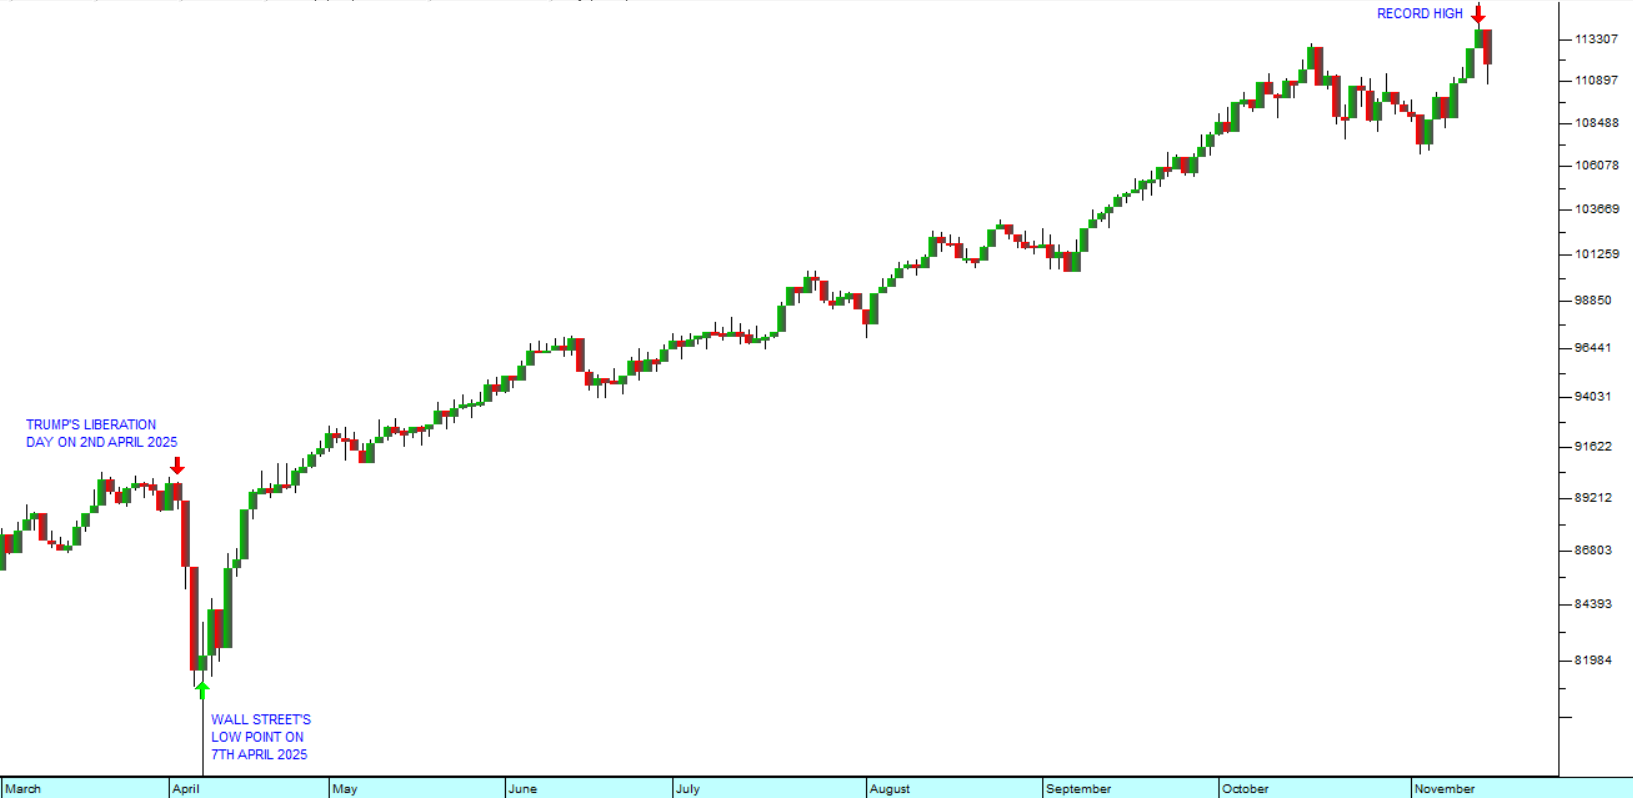
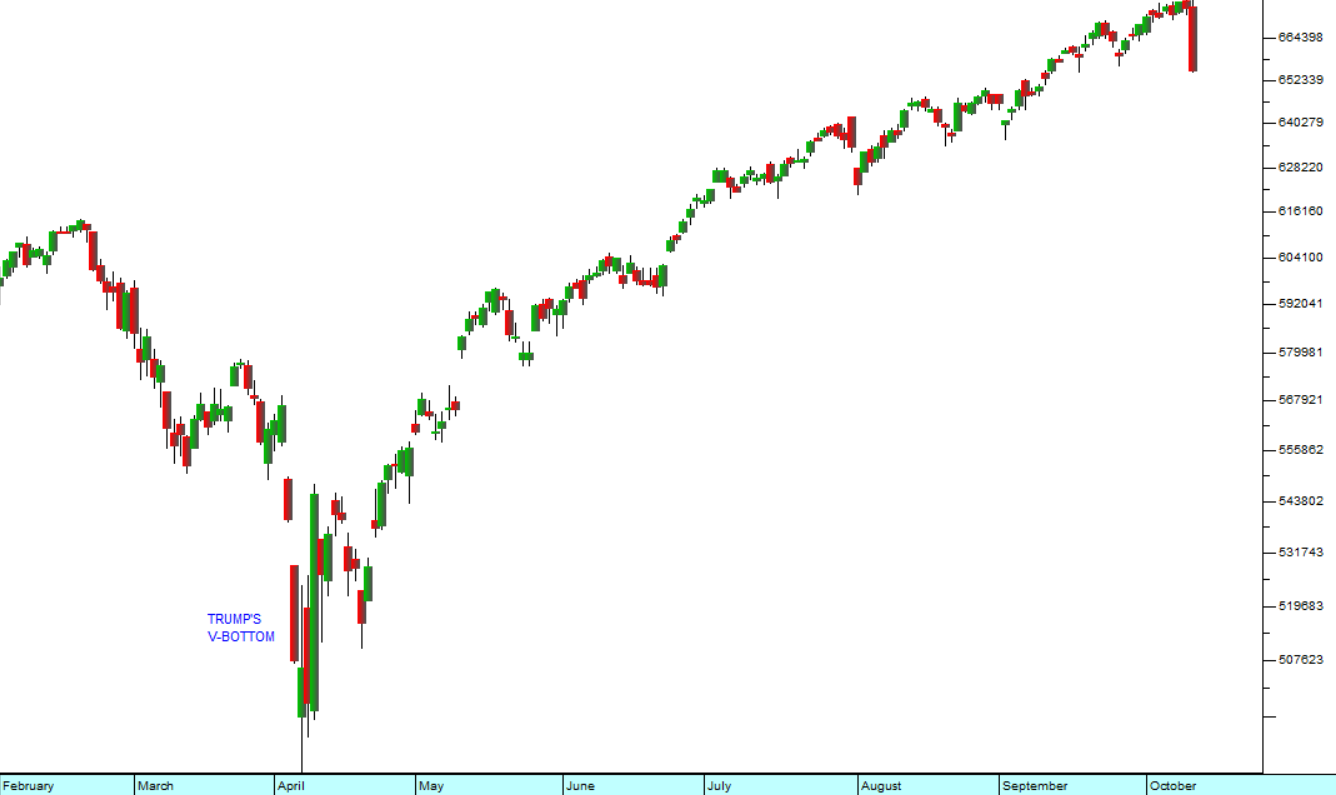
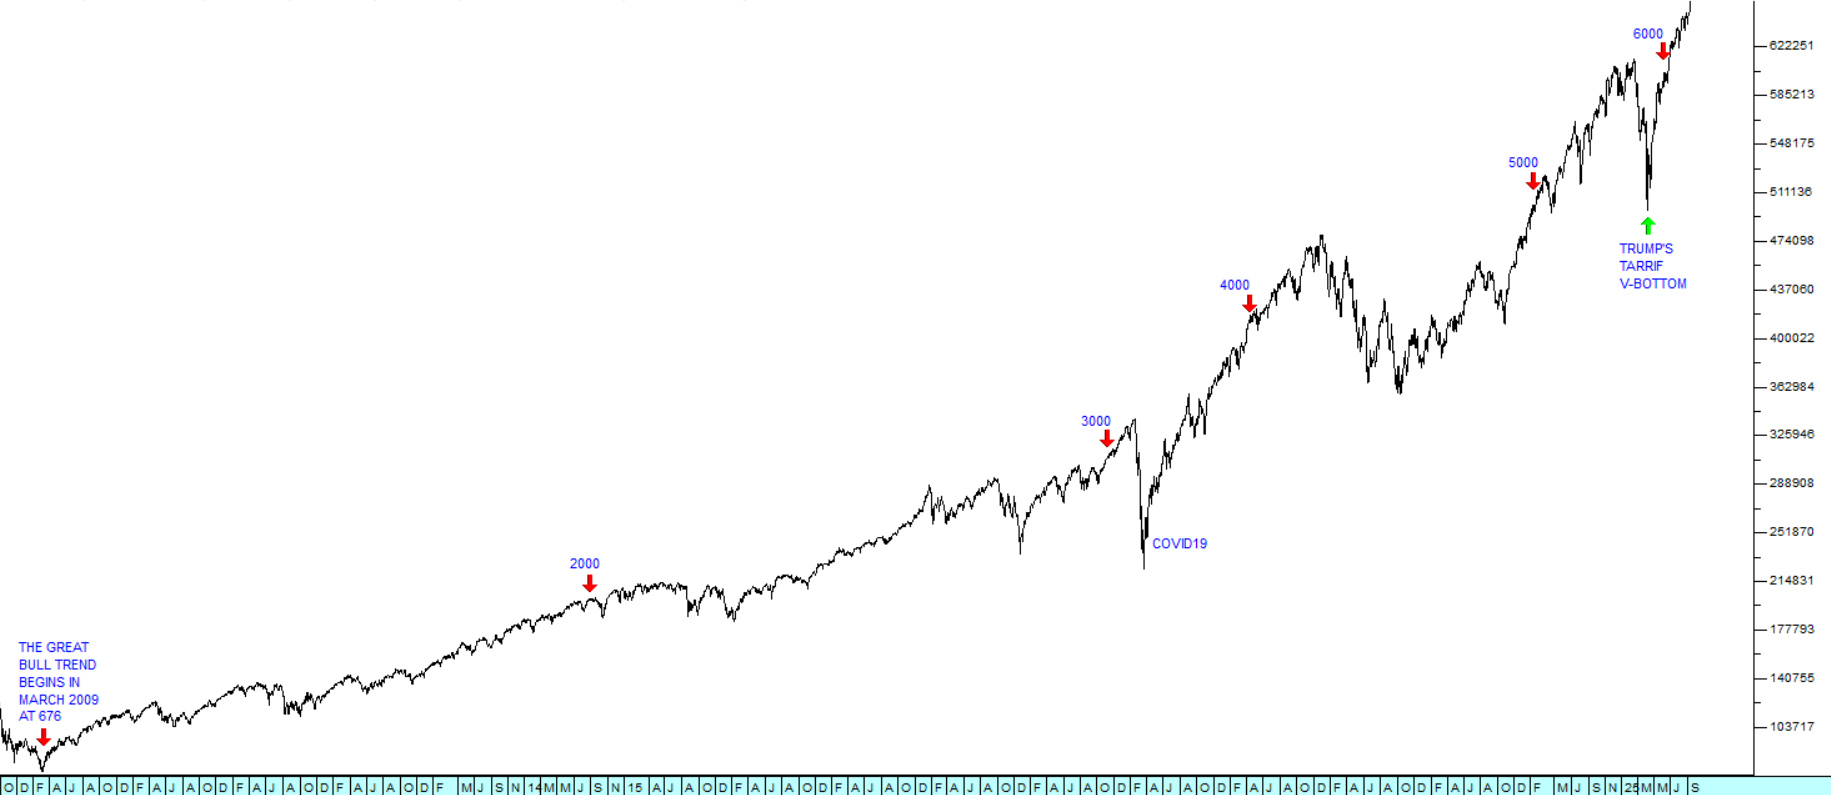
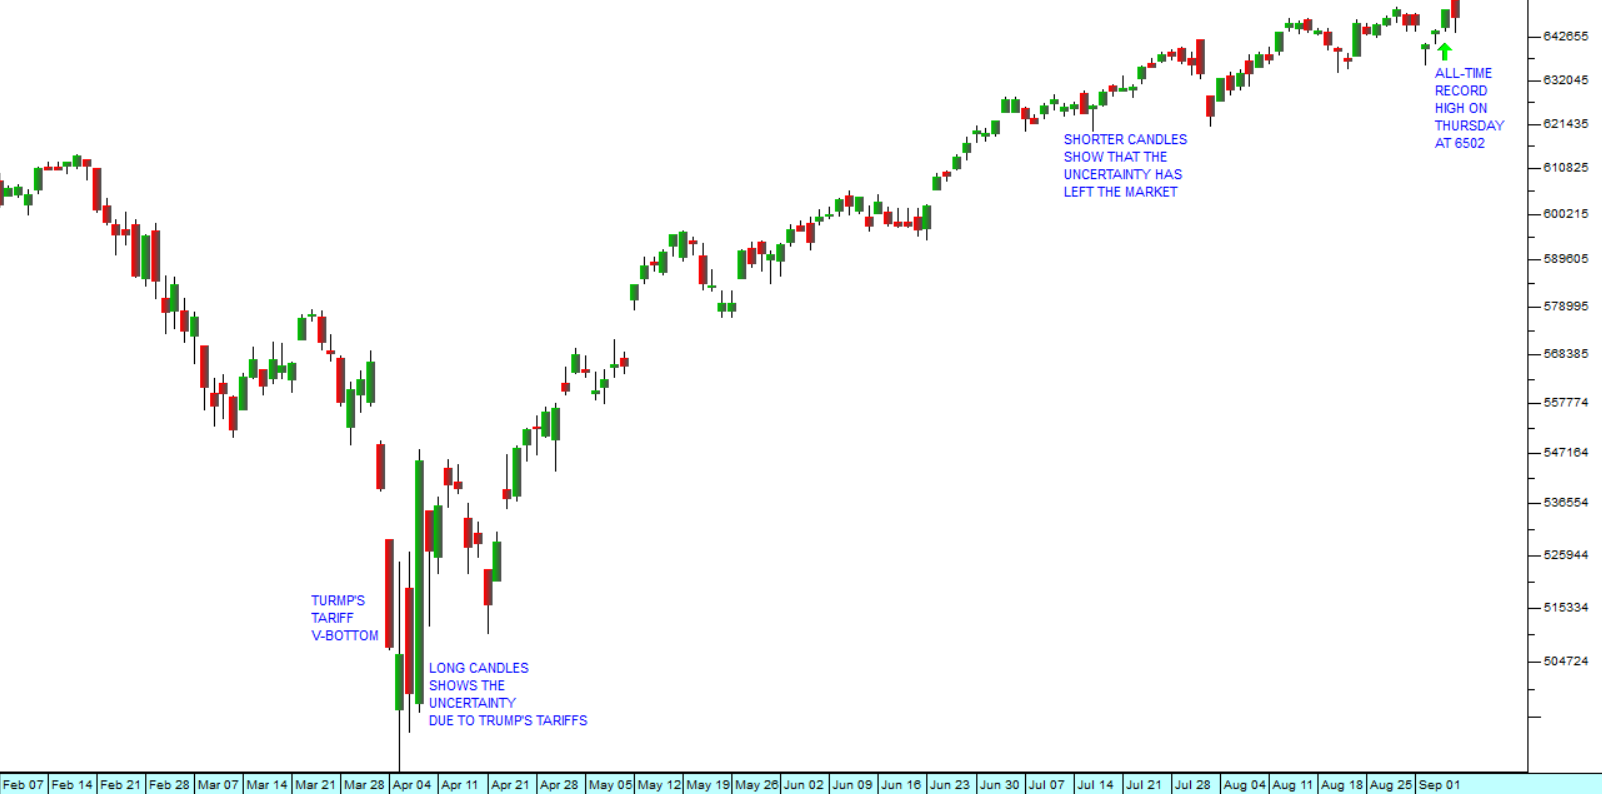
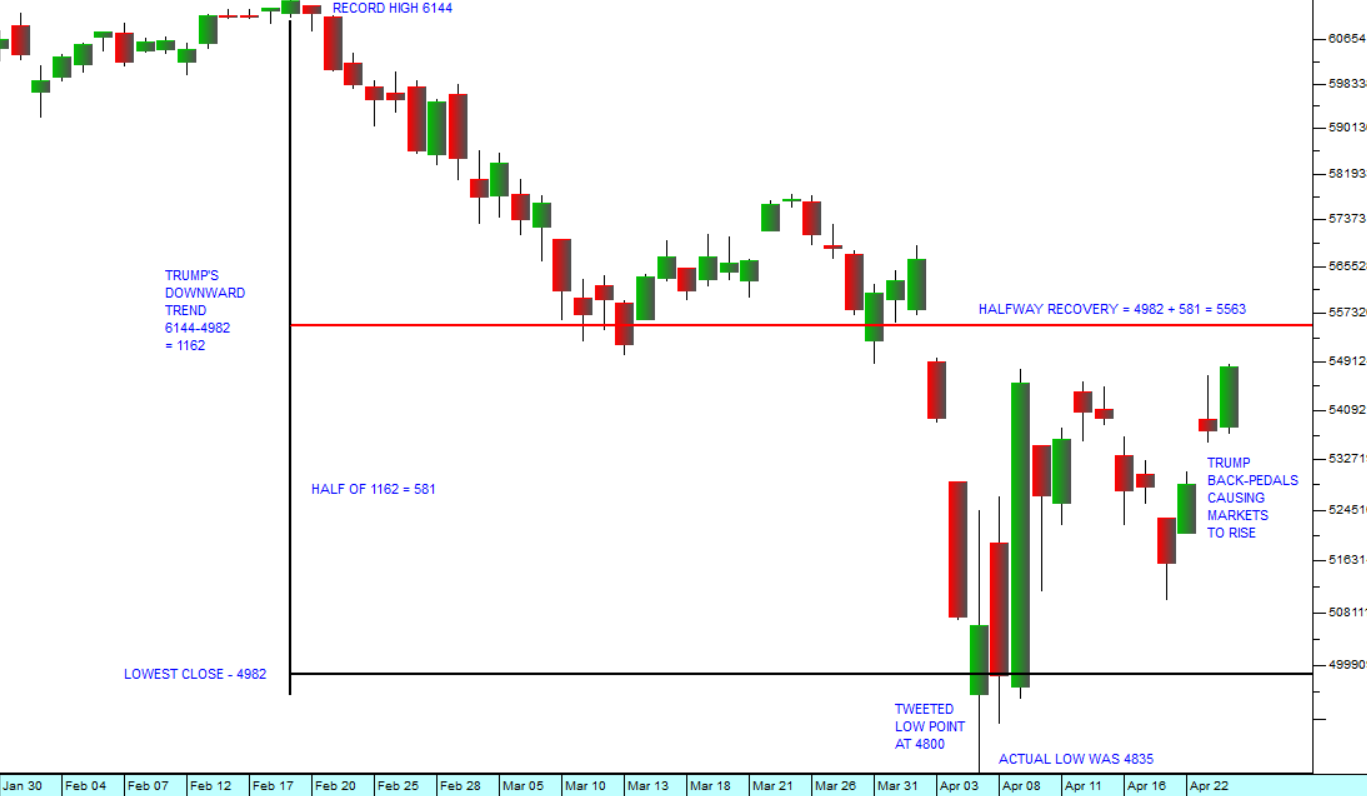
From his election victory on the 6th of November 2024, the markets went through a period of post-election euphoria which lasted until the 19th of February 2025. The S&P500 index peaked at 6144 on that day and then began a 19,23% correction which took it down 1162 points to a cycle low of 4982 on the 8th of April 2025. Consider the chart:
This correction was entirely a result of Trump’s absurd tariff policy and not a reflection of the American economy which was booming at the time.
Technically, major downward trends like this often go through what has become known as an A-B-C pattern. “A” is the initial downtrend, “B” is a 50% rally from that low point and “C” is the final leg down - taking the market to a point known as a “capitulation” where most investors simply give up on the market.
In the area where we are now and where the S&P closed last Friday at 5525 is critical. From the low point we have now recovered 47% of what was lost in the correction, so if we are going to have a further “C” downward leg, it will begin soon. Indeed, the further the index climbs above that 50% level (which in this case is 5563 on the S&P) the less likely that third leg becomes and the more likely it is that the previous record high of 6144 will be broken and the great bull market will resume.
By luck, we actually did call the intraday low point of this correction on the day that it happened – the 7th of April 2025. Early on that day, before Wall Street opened, we tweeted:
“The continuing weakness of the #rand indicates that the #riskon sentiment generated by #Trump's #tariffs is not yet over. Our expectation is that the #SP500 will fall by a further 5% to somewhere around 4800. At around that level we might expect at least a temporary bottom”.
Later that same day the S&P500 index did indeed make an intraday bottom at 4835.
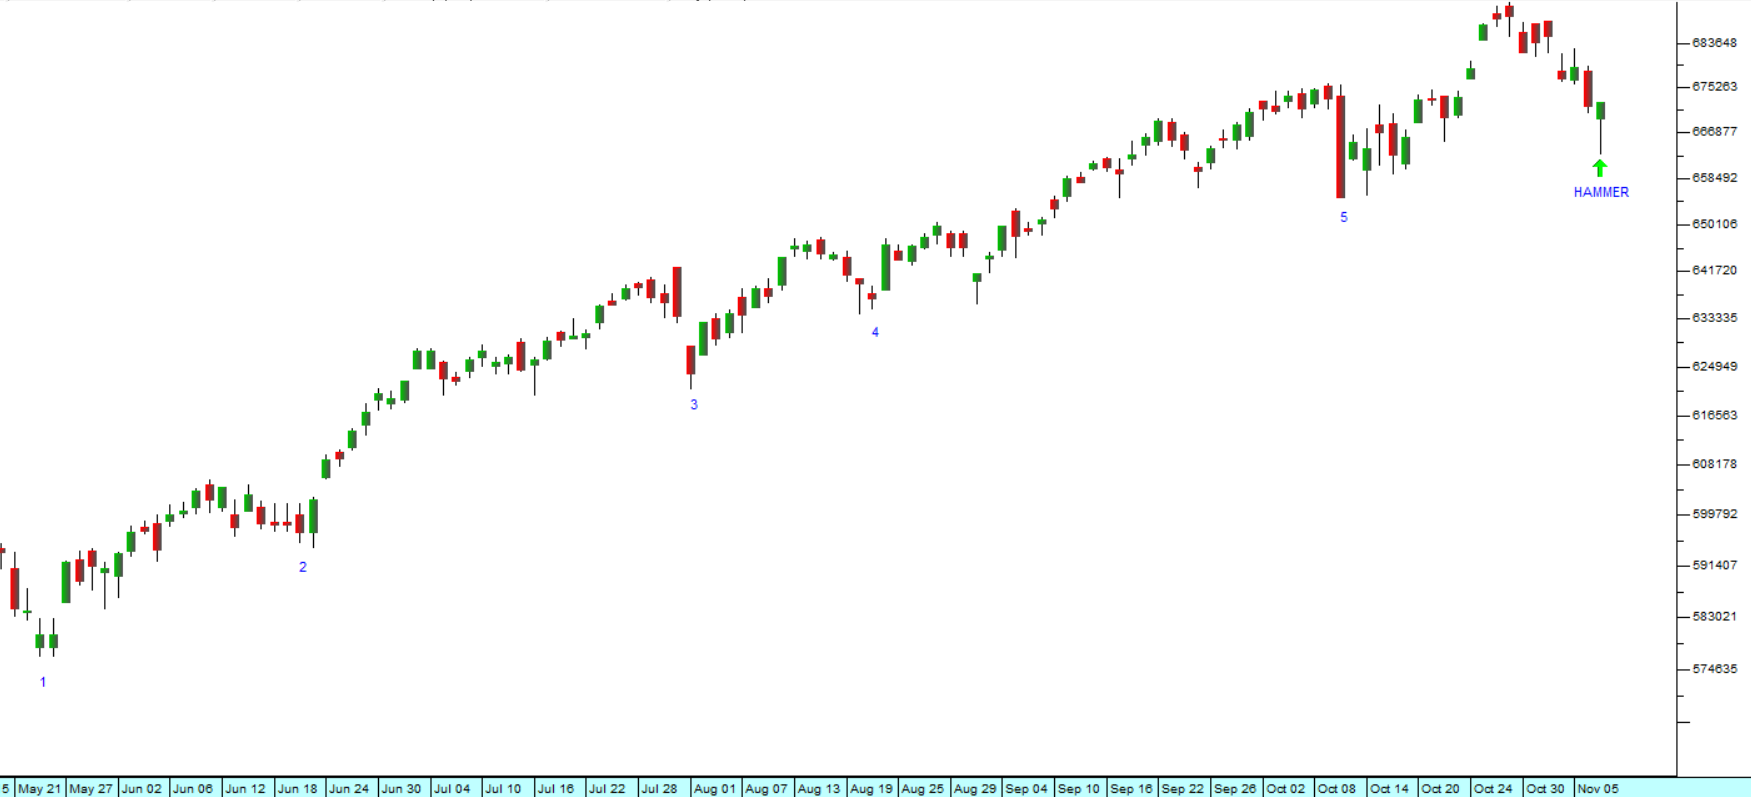
But what has been very interesting throughout this correction is that South African investors operating on the JSE have never really believed in or followed this correction on Wall Street. Consider the chart of the JSE Overall index over the same time period:
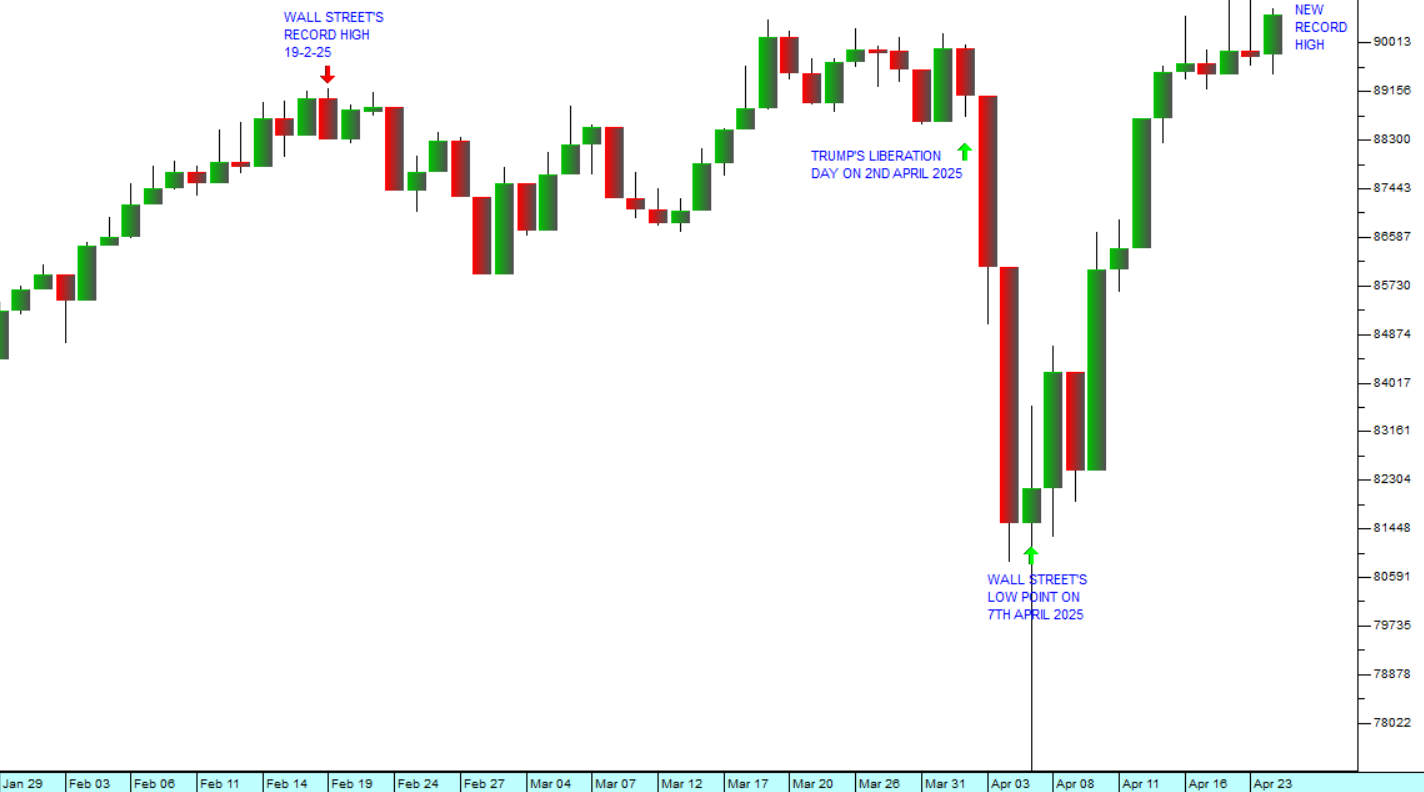
What you will notice here is that our Overall index has uncharacteristically taken almost no notice of this correction on Wall Street. Immediately following Trump’s infamous Liberation Day announcement, the Overall index did fall for a couple of days, but quickly recovered to reach a new all-time record high (last Friday).
This means that local investors focused on the underlying bull trend and were not much impressed by Trump’s shenanigans. They surmised that sooner or later he would be forced to back down and the well-established bull trend would resume – and that is exactly what is happening.
DISCLAIMER
All information and data contained within the PDSnet Articles is for informational purposes only. PDSnet makes no representations as to the accuracy, completeness, suitability, or validity, of any information, and shall not be liable for any errors, omissions, or any losses, injuries, or damages arising from its display or use. Information in the PDSnet Articles are based on the author’s opinion and experience and should not be considered professional financial investment advice. The ideas and strategies should never be used without first assessing your own personal and financial situation, or without consulting a financial professional. Thoughts and opinions will also change from time to time as more information is accumulated. PDSnet reserves the right to delete any comment or opinion for any reason.
Share this article: