Silver on the move?

26 July 2020 By PDSNET

One of our clients, Mr. Koot Jordaan, drew our attention to the fact that the rand price of silver, which has been underperforming gold since 2011, may be making an upside breakout.

Mr. Jordaan suggested that silver in both rands and US dollars had been moving in an extended sideways pattern. Consider the charts:

Silver in US dollars
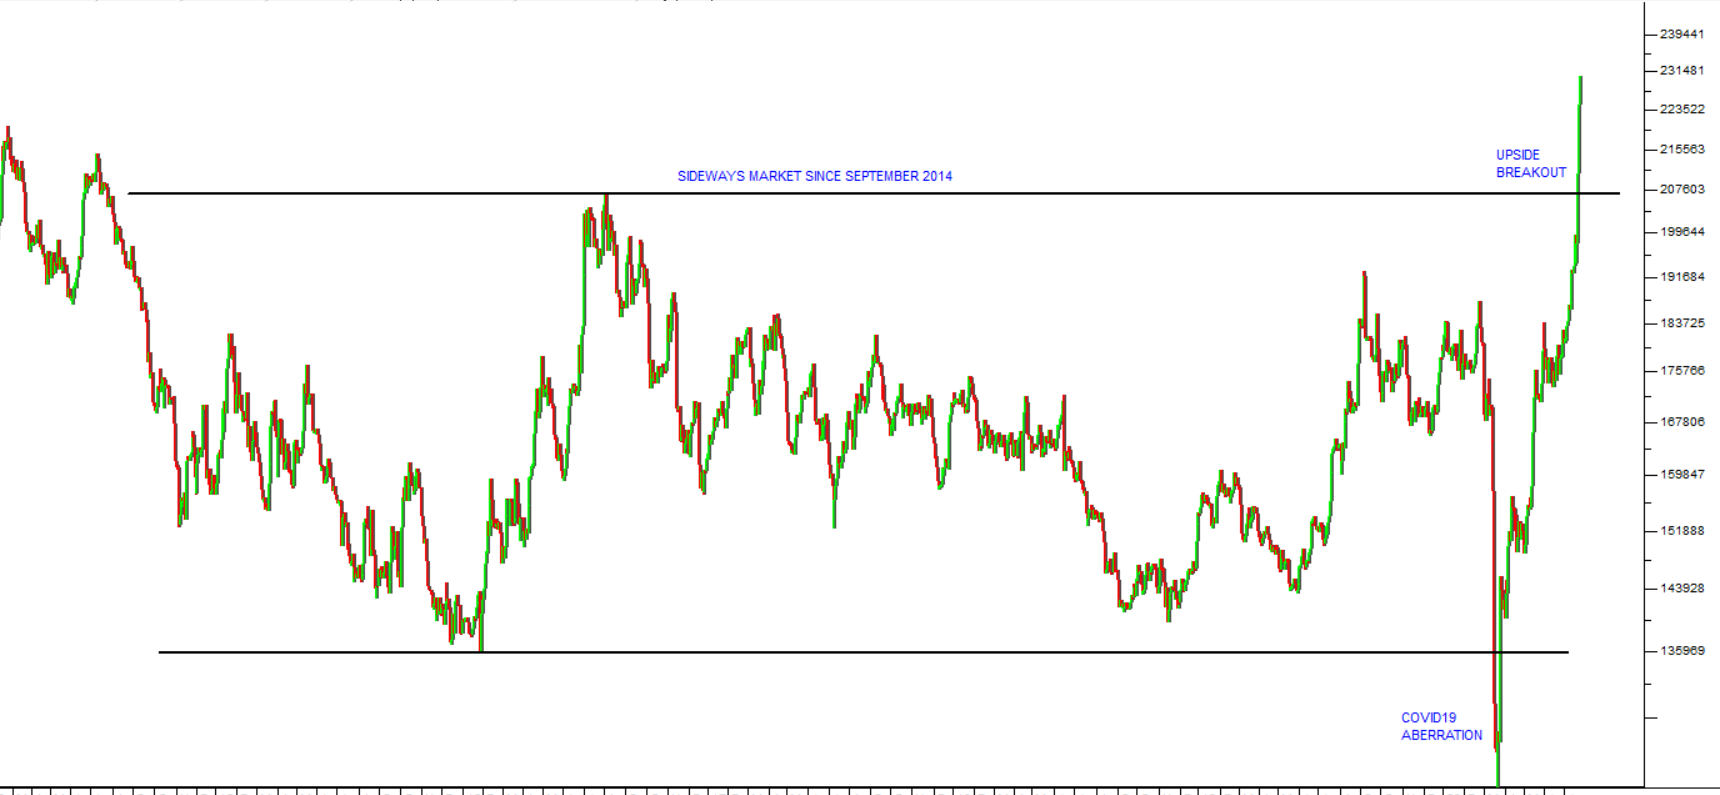
Silver price in US dollars: February 2014 to 26 July 2020. Chart by ShareFriend Pro

(We regard the downward break in March 2020 in the US dollar chart as an aberration.)

Silver in rands
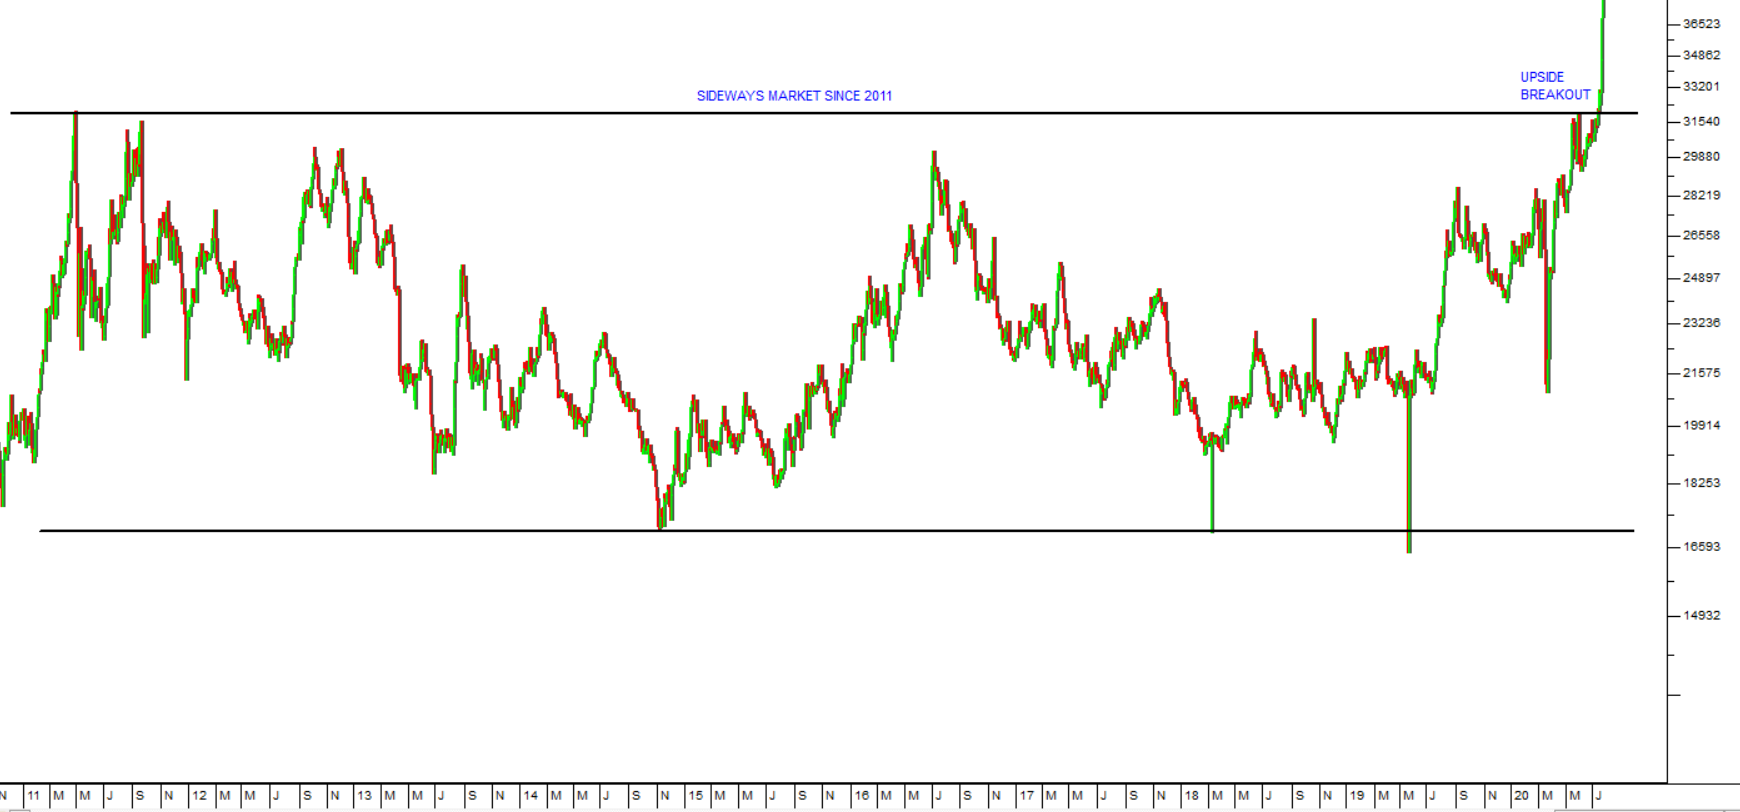
Silver price in South African rands: January 2011 to 26 July 2020. Chart by ShareFriend Pro.

You can see here that silver has been moving sideways in US dollars since September 2014 and in rands since 2011. Both charts also show an upside breakout in the last week or so.

Sideways markets like this are periods of consolidation. The price is “backing and filling” while it waits for new direction. The longer the sideways pattern continues, the further up the price will go once there is a clear upside breakout. That is the basis for the horizontal count method of point and figure (P&F) charting.

If you are unsure about horizontal counts in P&F refer to our article No. 49 “Upside Target” published in December 2016. https://www.pdsnet.co.za/index.php/upside-target/ We used a P&F horizontal count to predict that the S&P500 index, then trading for about 2050, would rise to 3027 – a target which it has subsequently far exceeded.

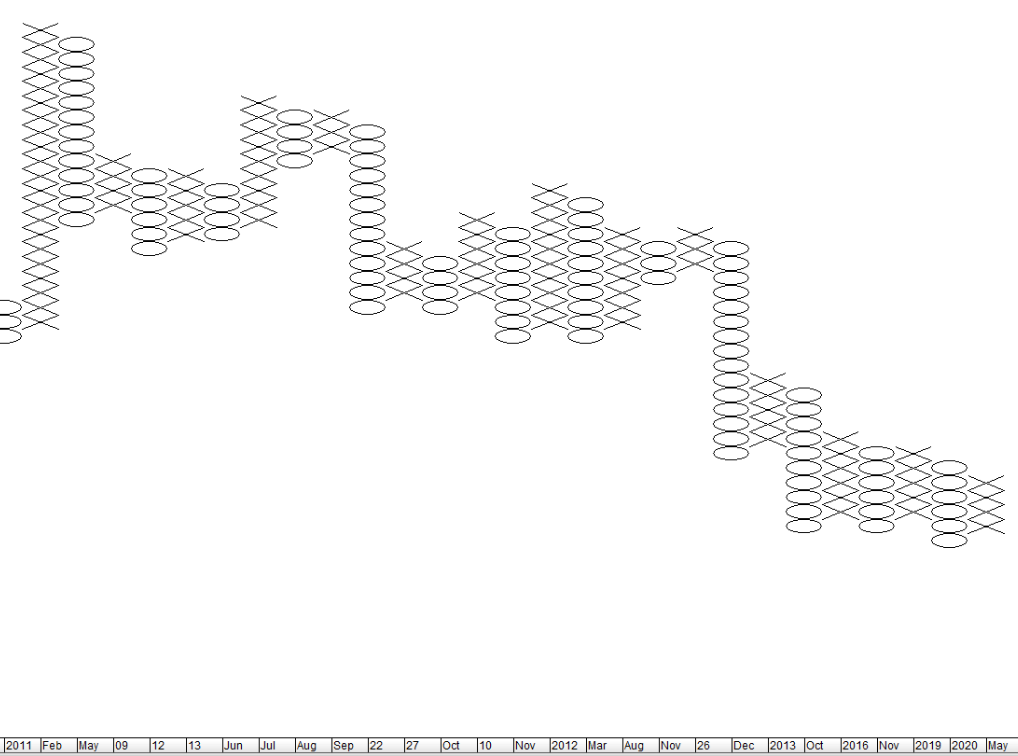
Using Metastock, we tried various box sizes to find an unbroken horizontal count. The following charts show our results:

Silver in US dollars
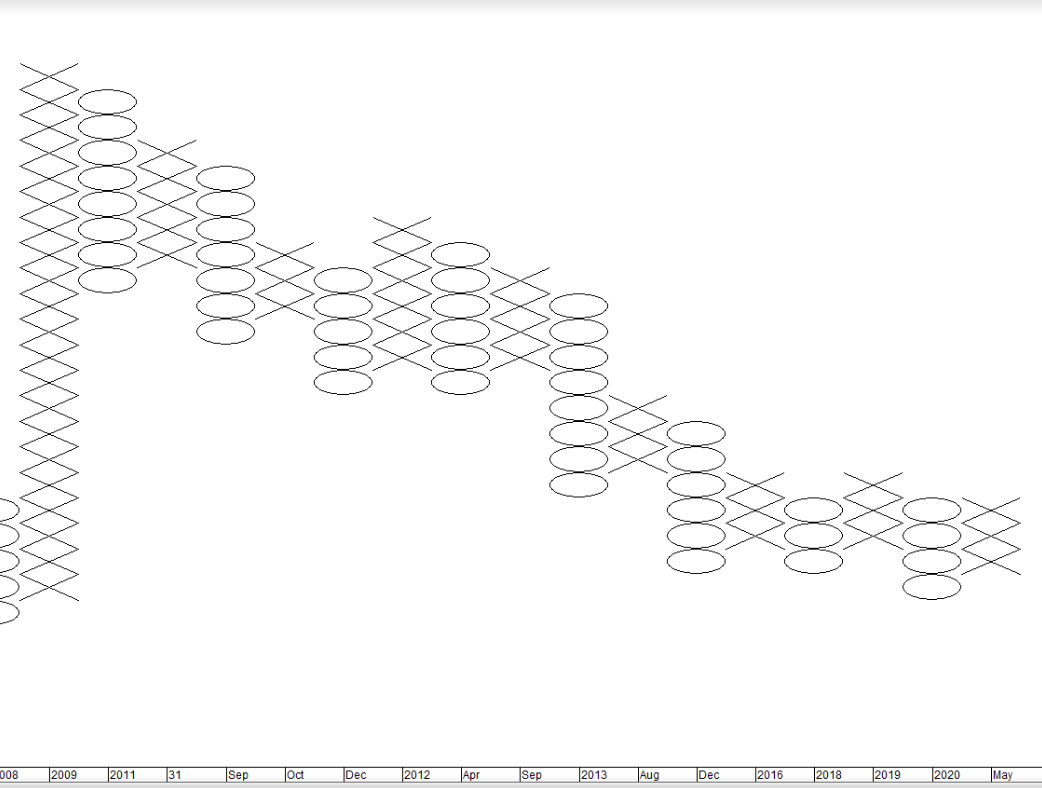
Silver price in US dollars: P&F Chart. Chart by MetaStock.

Silver in rands

Silver price in South African rands: P&F Chart. Chart by MetaStock

In both charts you can see there is an extended sideways pattern in the most recent years with an unbroken horizontal count of 6 in each case.

In US dollars, the horizontal count gives an upside target of $45.92 – more than double its current price.

Mr. Jordaan points out that historically it is normal for gold to move before silver. So, it is entirely possible that in the next few weeks, silver will catch up with gold as it has done in the past.

The only problem is that while both the rand and the US dollar line charts show an upside break, neither yet shows that break in P&F – which is necessary for the horizontal count target to be valid. Valid horizontal count targets in P&F are more than 70% accurate and usually conservative in our experience.


DISCLAIMER

All information and data contained within the PDSnet Articles is for informational purposes only. PDSnet makes no representations as to the accuracy, completeness, suitability, or validity, of any information, and shall not be liable for any errors, omissions, or any losses, injuries, or damages arising from its display or use. Information in the PDSnet Articles are based on the author’s opinion and experience and should not be considered professional financial investment advice. The ideas and strategies should never be used without first assessing your own personal and financial situation, or without consulting a financial professional. Thoughts and opinions will also change from time to time as more information is accumulated. PDSnet reserves the right to delete any comment or opinion for any reason.


Share this article:

PDSNET ARTICLES

Smart Local Investors

The last two months have been wild on the markets – mainly because of Trump’s ill-advised, on-again, off-again tariff policies. The issue now is:

Will this morph into a full-blown bear trend? Or is this correction almost over?

From his election victory on the 6th of November 2024,

Jerome Powell

The Federal Reserve Bank (“the Fed”) is completely outside the control of the President and Executive Branch of the US government. The chairman of the Fed is appointed for a renewable 4-year term by the President. The President cannot remove the Chair without cause. The current chairman, Jerome Powell was appointed by Trump during his first term as President and reappointed by

Uncertainty Soars

Investors are by their very nature risk takers, but they are always trying to reduce the risk which they have to take to a minimum. Donald Trump, with his threat of an international trade war and his on-again, off-again tariffs has significantly increased the level of risk in markets across the world. This can be seen in the extraordinary volatility in the S&P500

Liberation Day

Trump has done the unthinkable. He has deliberately engineered the collapse of the US and world stock markets in the nonsensical belief that somehow an international trade war will make Americans richer. Nothing could be further from the truth. His actions have taken the S&P down from its all-time record high of 6144.15 on 19th February 2025 to Friday’s

The Creation of Money

The money supply of a country is a symbol of the goods and services of that country. Obviously, if the size of the money supply is increased more rapidly than the real growth of its economy, then you have more money chasing the same goods and services, resulting in rising prices. Since, over the long term, the only organisation that can create money is the government,

V-Bottom is likely

The 10% collapse of Wall Street, which is a direct result of Trump’s random policy of on-again, off-again tariffs, is very similar to what happened to Wall Street in February/March 2020 when investors tried desperately to accurately discount the impact of the COVID-19 pandemic.

Normally, corrections in the market

The Trump Correction

It is relatively unusual for the activities of American presidents or what they say to have an impact on the New York Stock Exchange, especially during their first 100 days in office. Trump, however, is the exception. His confused, on-again, off-again rulings on tariffs have rattled the market. Markets hate uncertainty and even Trump himself doesn’t appear to know exactly

Dividends

Investors know that the return on a share is made up of a capital gain plus the dividend. Private investors are mostly attracted to the prospect of making a capital gain on the shares which they buy and do not often consider the dividends. What they perhaps do not realise is that a capital gain is actually just the dividend in a different form.

Quarterlies

One of the major differences between the US equity markets and the JSE is that listed companies in America are required to report every 3 months, not every 6 months as they are on the JSE. The quarterly reports of the S&P500 companies are closely followed by investment analysts and predictions are made for their profits.