Sasol: Resistance Becomes Support

23 July 2018 By PDSNET

Two years ago we wrote an article in which we drew your attention to the fact that Sasol, following its precipitous fall in 2014, had entered a sideways market bounded by support at R360 and resistance at R492. In September 2016, we suggested in another article that: It now looks, technically, as though the Sasol share price should move back up towards resistance at around R490 And that is what happened but only this year. Not only did the share reach that level (R492) but it broke above it giving a clear technical buy signal. So what happens next? Well, in technical analysis, once a well-established resistance line like this is broken, it then usually becomes a support line. Typically the shares price, having broken convincingly above the resistance, comes back to find that exact same level and bounces off it. Consider the chart:

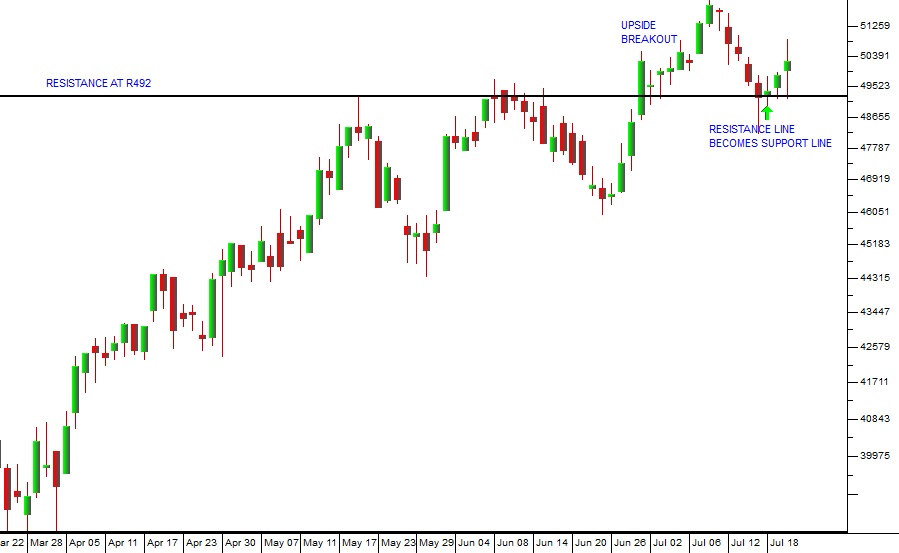
Sasol (SOL) March 2018 to July 2018 - Chart by ShareFriend Pro
Here you can see how the share broke above R492 reaching as high as R521 before falling back to R492 and bouncing off that level. Of course, the Sasol story is about the recovery of the oil price since the beginning of 2016. It is also important, however, that Sasol has moved away from oil and should begin commissioning its ethane cracker plant in the US later this year. The shift towards more chemicals is likely to see the share re-rated further. A point-and-figure horizontal count suggests that Sasol could go as high as R1257. Consider the chart:
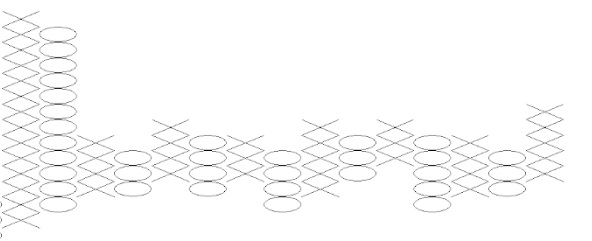
Point and Figure Chart of Sasol - Chart by Metastock
This chart shows the steep fall of Sasol shares from the high point in Mid-2014. That was followed by a sideways market which lasted almost 4 years. The longer a share remains in a sideways pattern the stronger and further it will rise once it breaks out of that market on the upside. So, in the case of Sasol, we were able to find an unbroken horizontal count of 13 using a box size of R23 and a 3-point reversal. Multiplying these three numbers together and adding the result to the lowest point in the sideways market (the support level of 360) we arrived at a target for Sasol of R1257 (R360 + (R23X3X13)). Horizontal counts in Point and Figure charting are about 70% accurate in our experience. We have a great lecture module on Point and Figure charting available at our online shop here - https://pdsnetshop.co.za/product/lecture-module-26-point-and-figure/ - Alternatively, please refer to lecture module 26 in our online course.


DISCLAIMER

All information and data contained within the PDSnet Articles is for informational purposes only. PDSnet makes no representations as to the accuracy, completeness, suitability, or validity, of any information, and shall not be liable for any errors, omissions, or any losses, injuries, or damages arising from its display or use. Information in the PDSnet Articles are based on the author’s opinion and experience and should not be considered professional financial investment advice. The ideas and strategies should never be used without first assessing your own personal and financial situation, or without consulting a financial professional. Thoughts and opinions will also change from time to time as more information is accumulated. PDSnet reserves the right to delete any comment or opinion for any reason.


Share this article:

PDSNET ARTICLES

The Debtors' Book

A BIT OF HISTORY

Many years ago, in 1982 when I started this business (which became “PDSnet”), I ran advertisements in both the Rand Daily Mail (RDM) and in the Star – which were the two most widely read newspapers in Johannesburg at the time. At that time, we were a very small business and had no credit rating at all. Despite this the RDM immediately

WeBuyCars - Results

The financial results of companies show how profitable they are and give a good indication of their share’s risk and potential return. WeBuyCars (WBC) is a recent listing which came to the JSE on the 11th of April 2024. Unlike other listed motor vehicle companies, it is a company which specialises in the purchase and sale

Choosing Winners

We are often asked how we go about selecting the shares to put on to the Winning Shares List (WSL). Right now, there are 102 shares on the list with 5 having gone down since they were added, 94 are up and 3 are unchanged. On an annualised basis, 24 of them are performing at above 100% per annum.   

As a private investor,

Kore Revisited

Kore (KP2) remains at once the most exciting and most risky investment on our Winning Shares List (WSL) at the moment. We originally added it to the list just over a year ago on 16th May 2024 at a price of 20c. It subsequently rose to a high of 83c on 3rd October 2024 and we published an article

Rand Strength 2025

The strength of the rand is both a critical and a complex issue for private investors on the JSE. Our currency is influenced by two primary forces:

  1. Our local economy’s prospects
  2. The rand’s role as a leading emerging market currency

These, in turn, are

Sibanye Revisited

In these uncertain times, when nobody really knows to what extent Trump will back down on the international trade war which he has initiated, many investors are moving into precious metals as a hedge against the weakness of paper currencies (especially the US dollar) and paper assets like equities and bonds.

The problem

Smart Local Investors

The last two months have been wild on the markets – mainly because of Trump’s ill-advised, on-again, off-again tariff policies. The issue now is:

Will this morph into a full-blown bear trend? Or is this correction almost over?

From his election victory on the 6th of November 2024,

Jerome Powell

The Federal Reserve Bank (“the Fed”) is completely outside the control of the President and Executive Branch of the US government. The chairman of the Fed is appointed for a renewable 4-year term by the President. The President cannot remove the Chair without cause. The current chairman, Jerome Powell was appointed by Trump during his first term as President and reappointed by

Uncertainty Soars

Investors are by their very nature risk takers, but they are always trying to reduce the risk which they have to take to a minimum. Donald Trump, with his threat of an international trade war and his on-again, off-again tariffs has significantly increased the level of risk in markets across the world. This can be seen in the extraordinary volatility in the S&P500

Liberation Day

Trump has done the unthinkable. He has deliberately engineered the collapse of the US and world stock markets in the nonsensical belief that somehow an international trade war will make Americans richer. Nothing could be further from the truth. His actions have taken the S&P down from its all-time record high of 6144.15 on 19th February 2025 to Friday’s