Relative Strength
28 February 2019 By PDSNETAnalysing the market is mostly about trying to determine where the best opportunities lie. There are about 400 shares listed on the JSE, but which of these offer the best opportunity for profit? So finding the best share invariably means comparing one opportunity with another. There are very few indicators which do this better than the comparative relative strength. This indicator (found at the bottom of a chart in ShareFriend as �CRSI�) is simply a formula which divides one datastream by another and then draws a graph of the result. For example, the price of Dischem was 2694c at the close of trade on 14th February 2019. On that day, Clicks closed at 17700c. So if you divide 2694 by 17700 you would get 0,1522 � that is a relative strength point.
Of course, the bald relative strength level means nothing on its own. It is the trend that will show you whether Dischem�s share price is outperforming Click�s share price or vice versa. If the relative strength rises it means either that Dischem is rising more quickly than Clicks or that it is falling less quickly. Either of these situations will cause the relative strength graph to rise. Consider the chart:
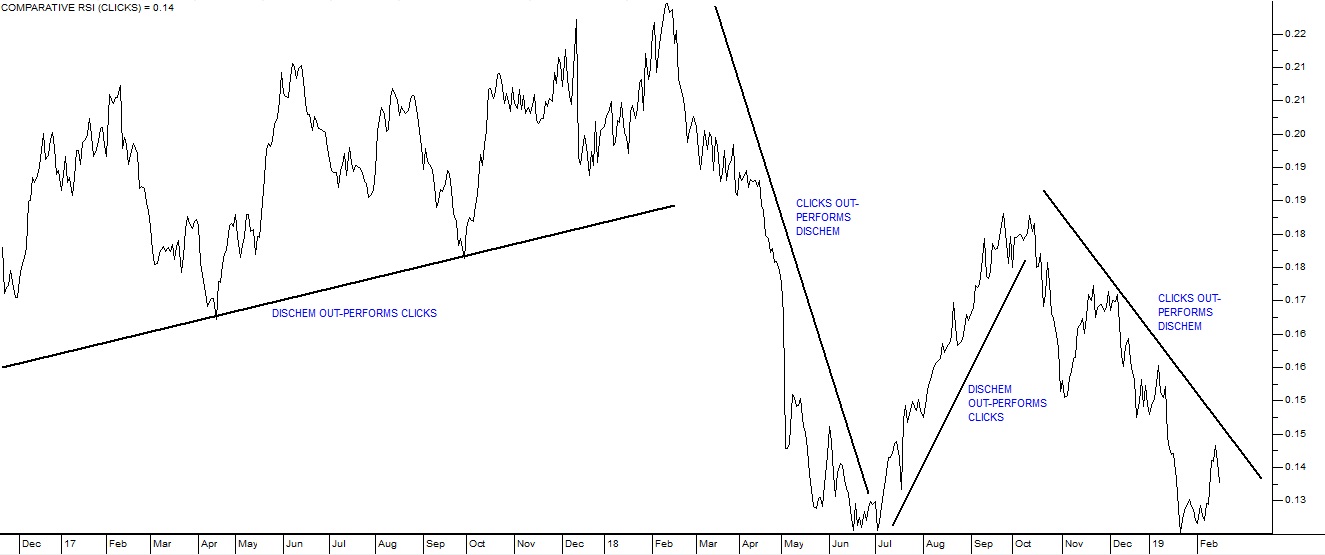
From November 2016, when it listed on the JSE, Dischem out-performed Clicks. Then there was a period from February to July 2018 when Clicks performed better. Dischem recovered from July to October 2018, but since then has been under-performing. Let�s consider another example. Your software contains a chart of the Krugerrand price in rands going back to 1985. During that 34-year period, the gold coin has appreciated steadily � compensating for the steady decline in the value of the rand. What is interesting is to do a relative strength of the Krugerrand against the rand price of gold. The following chart shows the Krugerrand (the top chart) and its relative strength against the rand price of gold (the bottom chart) � over the past ten years:
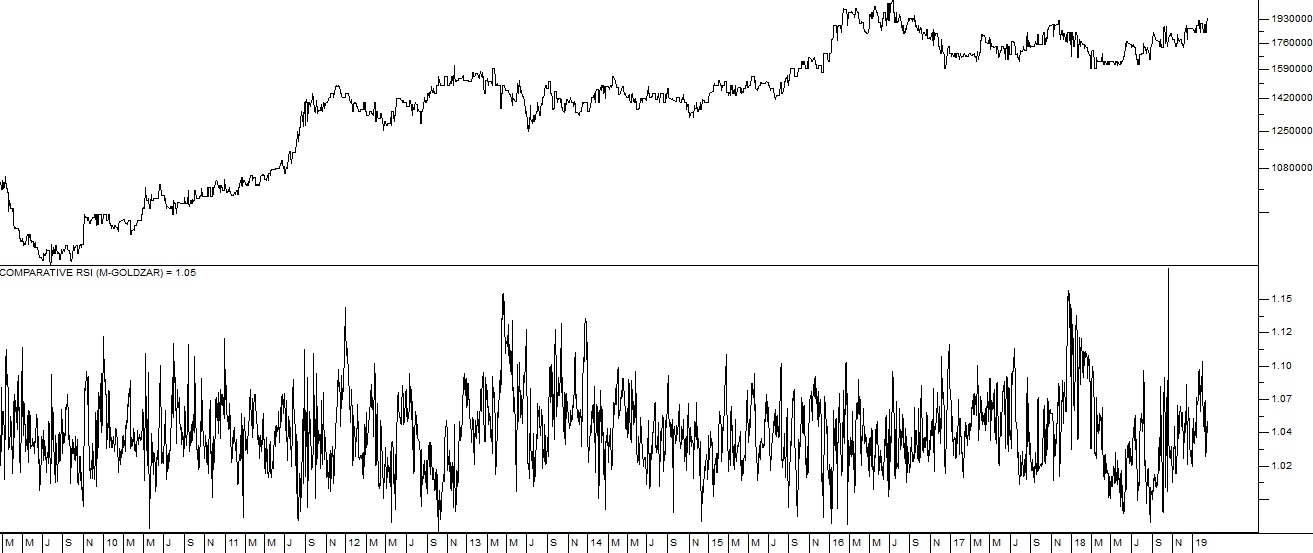
In general, the Krugerrand trades at a slightly higher price than the rand price of gold because it is in a highly tradable and transportable form � which gives it a slight additional value. What you can see from the relative strength chart is that, as you would expect, the relative strength remains fairly constant. However, there is a variation between 1 and 1,15 � which shows that changes in the rand price of gold are not always immediately reflected in the Krugerrand price. Perhaps there is an opportunity to buy Krugerrands when they are at or slightly below parity with the rand price of gold and then sell them when they are trading for 10% to 15% more than the rand price. Your software contains about 1200 different datastreams including shares, currencies, indexes, commodities and many other tradable securities. Finding reliable relationships amongst these financial indicators can give useful insight into when particular securities are over- or under-priced.
DISCLAIMER
All information and data contained within the PDSnet Articles is for informational purposes only. PDSnet makes no representations as to the accuracy, completeness, suitability, or validity, of any information, and shall not be liable for any errors, omissions, or any losses, injuries, or damages arising from its display or use. Information in the PDSnet Articles are based on the author’s opinion and experience and should not be considered professional financial investment advice. The ideas and strategies should never be used without first assessing your own personal and financial situation, or without consulting a financial professional. Thoughts and opinions will also change from time to time as more information is accumulated. PDSnet reserves the right to delete any comment or opinion for any reason.
Share this article: