On Balance Volume

19 July 2020 By PDSNET

The On Balance Volume (OBV) indicator was developed by Joseph Granville in 1963, when he published his book “Granville’s New Key to Stock Market Profits”. Basically, Granville drew investors’ attention to the importance of the daily volume traded in a share. His motto was “volume leads price” – by which he meant that you will often see sharp rises in volume, accompanied by small increases in price just before the share price rises significantly.

To exploit this, he developed the OBV. This technique is very simple from a mathematical point of view. You begin with an arbitrary number like 100 000 and the on days when the share’s price rises you add the volume and, on the days when it falls, you subtract the volume. Then you draw a chart of the result. Granville had to draw that chart by hand, but today your computer can do it automatically. What you are looking for is a sudden almost vertical rise on the OBV. Granville said it must go up at an “acute angle” to the vertical. Consider the chart of Labat, which we drew to your attention on 22nd June 2020:

Labat: 24 February 2020-14 July 2020. Chart by ShareFriend Pro.

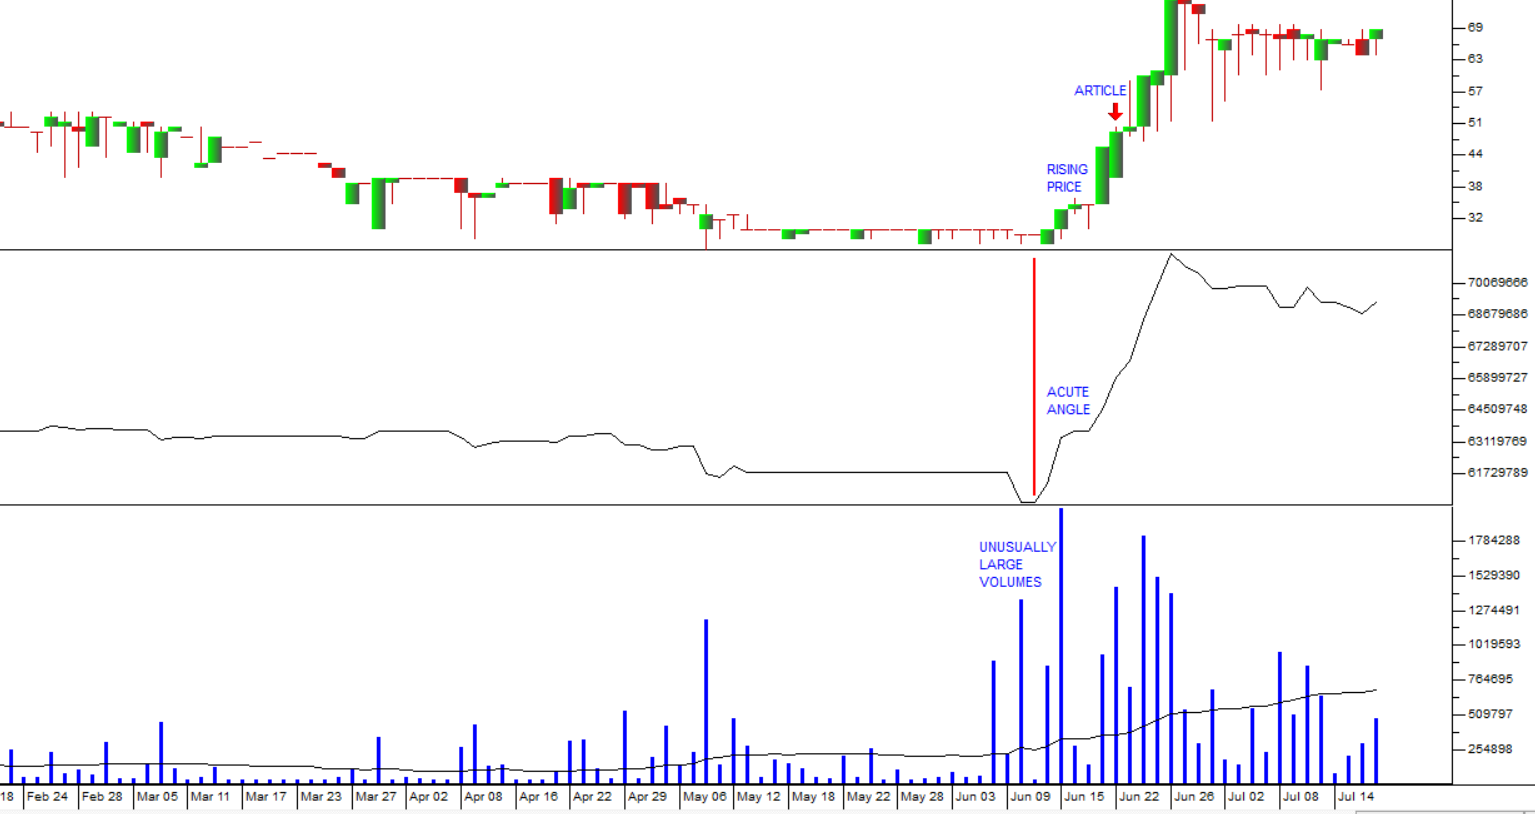
The top chart shows a standard candlestick chart, the middle chart is the OBV and the bottom chart is a volume histogram. You can clearly see the acute angle to the vertical (the red line) made by the OBV in the middle chart and you can see that the cause is small increments in price accompanied by large increases in volume.

What you are looking at is insider trading. In every company there is a group of maybe six people who are very close to the action. They are usually directors or senior management and they know of important developments long before the rest of the investors. Inevitably, they will trade on that knowledge – usually indirectly through a third party so that they are not caught. Of course, this is illegal, but it goes on all the time.

The point is that it cannot be hidden from the technical analyst. It leaves a footprint in the chart. Prices begin to rise by small increments as the “strong hands” (the insiders) mop up all the shares they can lay their hands on and the “weak hands” let the shares go for a slightly better price because they have no idea what is about to happen. The result is a sharply rising OBV.

Here are two more recent examples:

Pan African: 31 January 2020-14 July 2020. Chart by ShareFriend Pro.

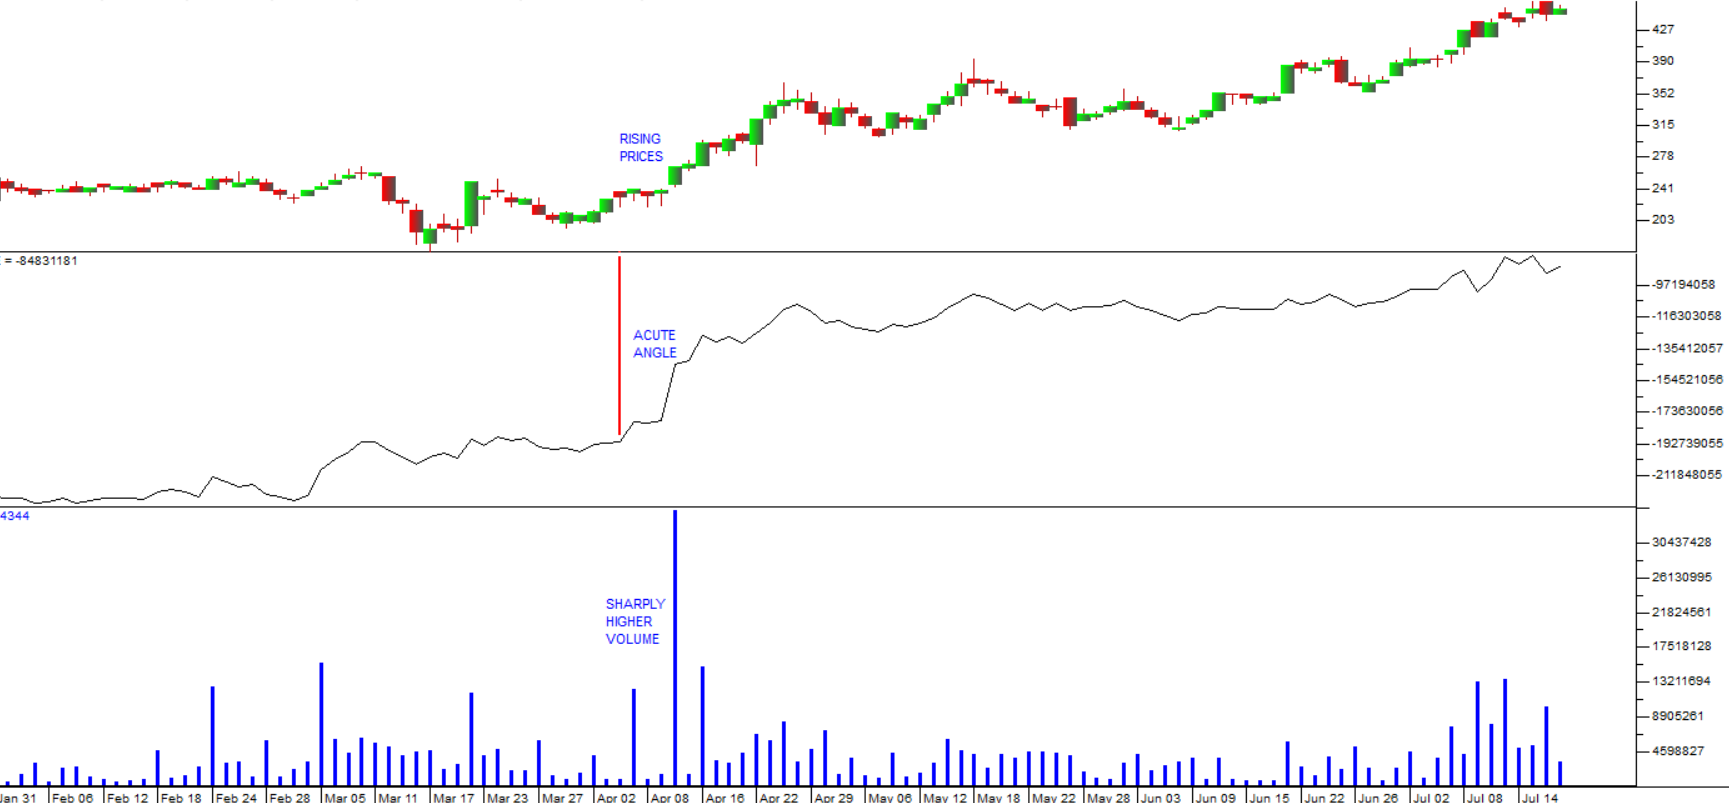
This share is Pan African, and you can see here the same sort of pattern of rising prices accompanied by a large increase in volume leading to a sharp upward move in the OBV.

Quantum: 18 February 2020-14 July 2020. Chart by ShareFriend Pro.

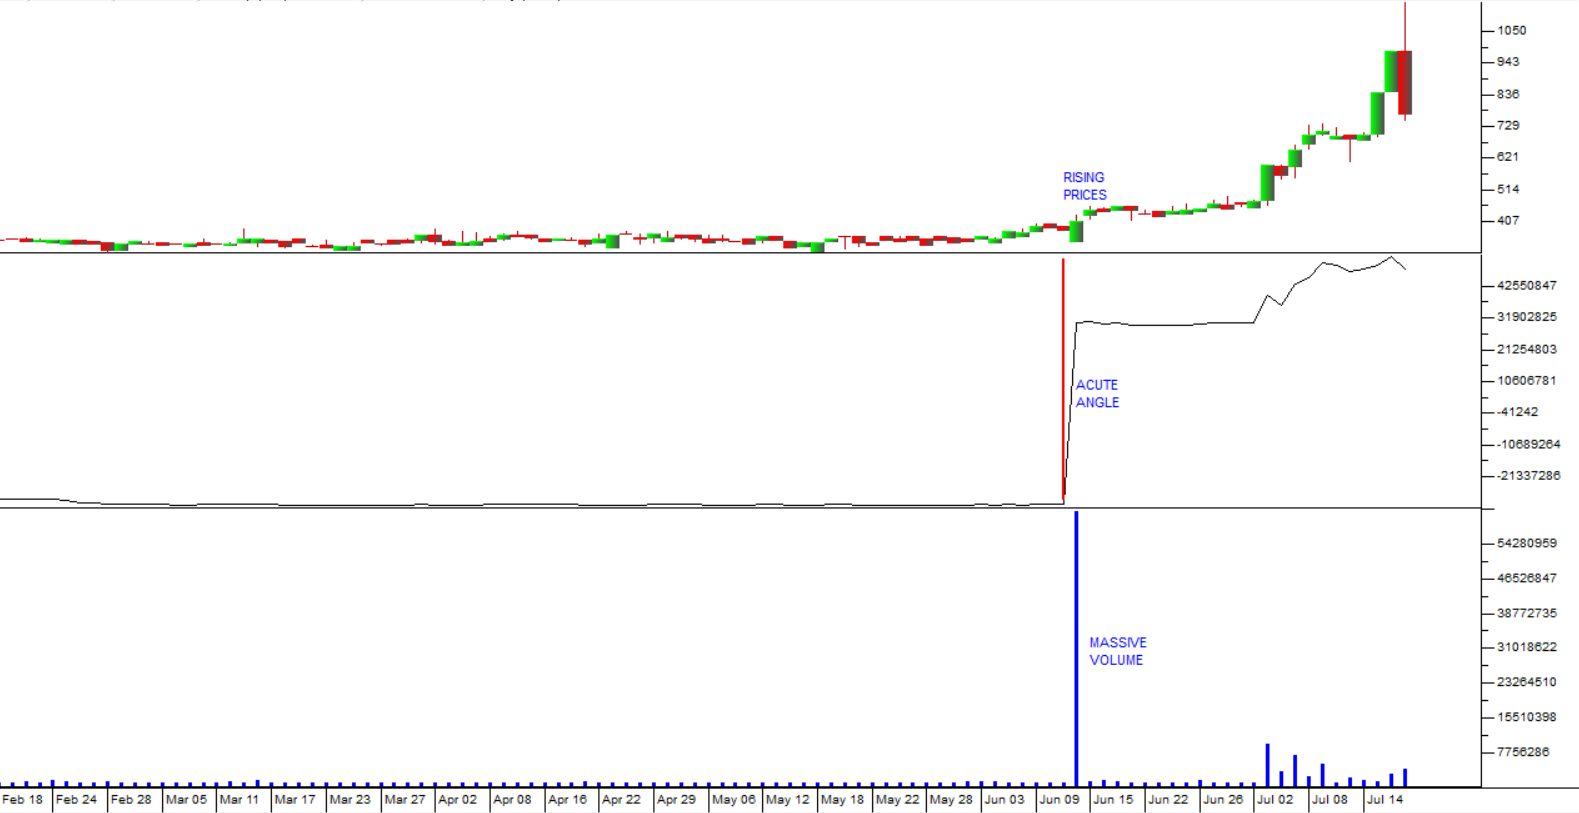
This share is Quantum. The same basic OBV pattern is visible here.

After giving the OBV signal, Labat went up by 114% in the next six trading days, Pan African went up by 70% over the next 3 months and Quantum went up by 120% in the next 23 trading days.

In all three cases the volume increase came after months of very low volumes and a price which was virtually flat or even falling. Without the OBV signal it would have been difficult to pick up what was happening.


DISCLAIMER

All information and data contained within the PDSnet Articles is for informational purposes only. PDSnet makes no representations as to the accuracy, completeness, suitability, or validity, of any information, and shall not be liable for any errors, omissions, or any losses, injuries, or damages arising from its display or use. Information in the PDSnet Articles are based on the author’s opinion and experience and should not be considered professional financial investment advice. The ideas and strategies should never be used without first assessing your own personal and financial situation, or without consulting a financial professional. Thoughts and opinions will also change from time to time as more information is accumulated. PDSnet reserves the right to delete any comment or opinion for any reason.


Share this article:

PDSNET ARTICLES

Bell Equipment

We are often asked what prompts us to add a share to the Winning Shares List. The answer is that it is a variety of factors – but usually because the share appears to be very cheap in relation to its fundamentals. In other words, we expect it to be upwardly re-rated as its fundamental value becomes recognised by the institutional fund managers. A

JSE All Time Record High

On Friday last week, the 12th of July 2024, the JSE Overall index closed at 81686 – an all-time record high. Consider the chart:

The chart shows that the Overall

Construction

The entire construction industry was decimated by the 2008 sub-prime crisis, the ANC under Jaco Zuma’s presidency and then finally by the pandemic in 2020. Hundreds of thousands of jobs were lost and massive companies like M&R were reduced to penny stocks on the JSE.

The JSE Construction and Materials Index (JS5011)

Murray & Roberts

A company’s debt is critical in establishing the risk inherent when investing in its shares. High debt levels expose the company to high interest and capital payments and can swallow up a large part of whatever profits it makes. Low debt levels give the company the headroom to invest in further growth either organically

Mr Price

Mr Price is a well-known and focused retailer of clothing in South Africa. It is a quintessentially South African company, and its performance is a direct reflection of the state of the economy and the level of consumer spending. It is an extremely well-managed company in a very tough and competitive market. Clothing is sold by many dedicated outlets in South Africa and almost

Uncertainty = Risk = Volatility

We live in uncertain times. Among the sources of this uncertainty are the final outcome of the recent local elections (i.e. what the shape of our future government will take) and the prospect of the American elections on 5th November 2024. In the background are the wars in Ukraine and the Middle East which constantly threaten to escalate.

The uncertainty

Winning Shares List

Investment in the share market is not about certainties – it is about probabilities.

Success comes from bending the odds in your favour, so that it becomes like playing a roulette table where you have a 60% or 70% chance of winning.

That, of course, means that you must fully expect to lose 30% or

Wall Street and the Rand

As South Africa edges closer to election day, the ANC has been desperately doing everything in its power to pass populist measures to bolster its waning support, especially with the country’s lower income groups. This includes the signing of the highly controversial National Health Insurance (NHI) bill into law by President Ramaphosa.

There

Pan African Resources

In our opinion, the gold price in US dollars should continue to perform well for the rest of 2024 with the potential for rising inflation and increasing political instability in various parts of the world. The upward trend will, of course, be marked by corrections, but the overall direction of the trend is clear. Consider the chart:

Market Overview

This week, the US Federal Reserve Bank’s monetary policy committee (MPC) held interest rates unchanged at their historically high levels and said that they intended to hold rates at these high levels for longer than previously expected. This information was followed by the April 2024 non-farm job creation number which came in at 175 000 – considerably