Nampak
21 August 2023 By PDSNETThe story of Nampak is a classic of a solid blue-chip share and institutional favourite which became over-confident, over-extended itself and got mired in excessive debt. Then, finally, after 8 years of anguish and decline followed by an abrupt change of management, the company returned to the sound business principles of cutting debt through:
- The sale of non-core assets,
- Strict working capital management and
- Overhead cost reductions.
- Raising additional capital from shareholders
Consider the chart:
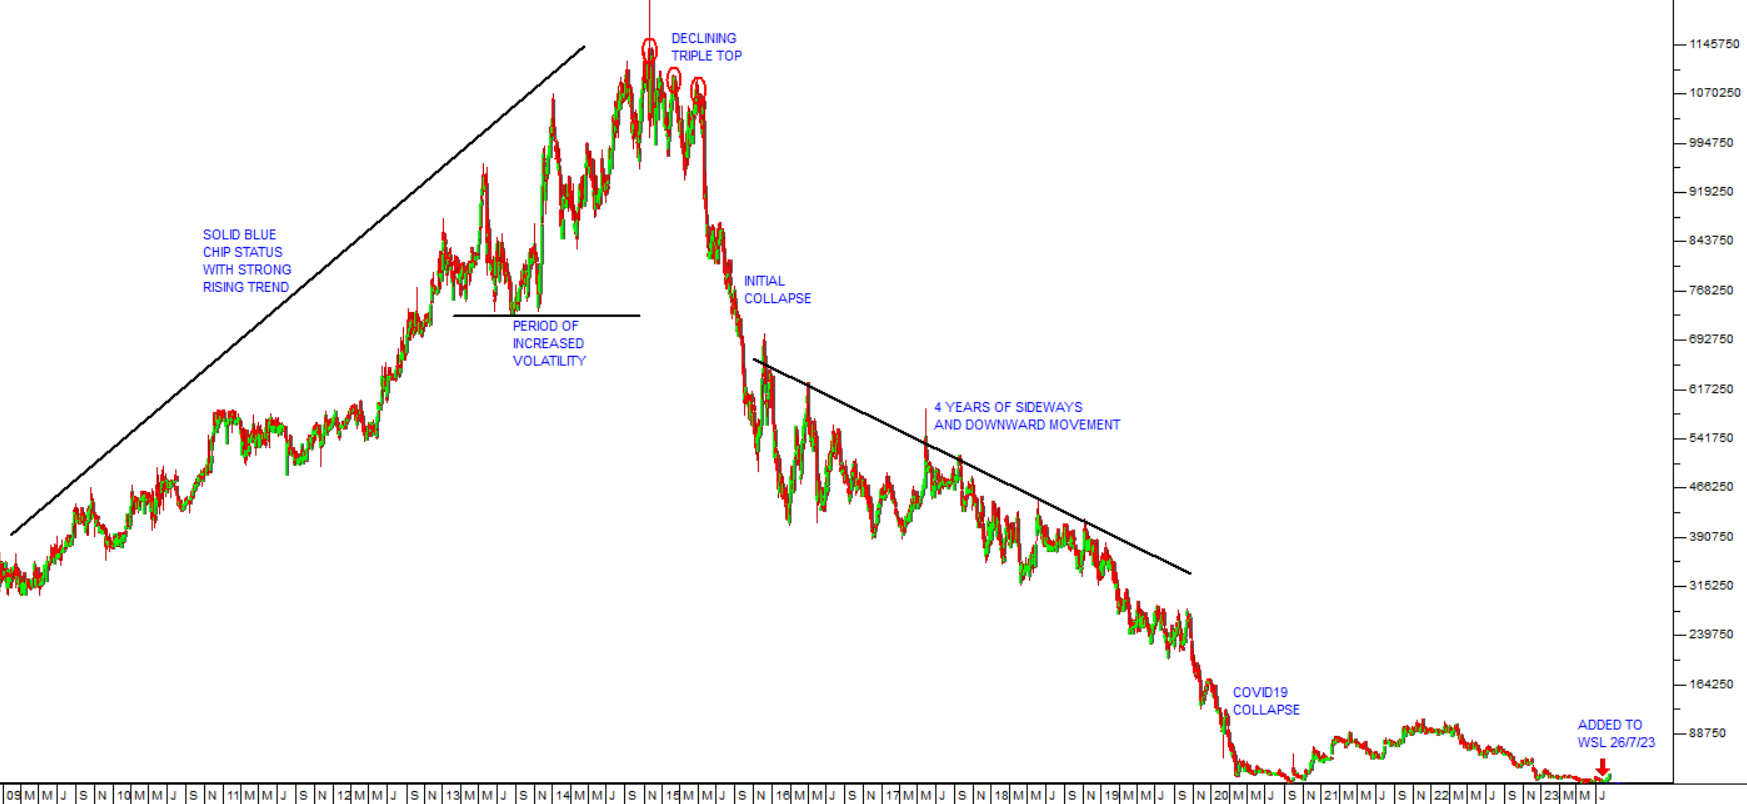
Prior to 2015, Nampak was considered to be one of the best-run high-quality shares on the JSE. It was a darling of institutional fund managers and had a well-established place in most institutional portfolios. The share was rising steadily on the back of rising dividends and good prospects. The directors at Nampak then became over-confident and raised massive debt finance to expand into the rest of Africa (Angola and Nigeria) which was a very fashionable move among JSE executives at the time.
The party came to an end in November and December 2014 and it is important to observe that, despite the warning signs, most institutional fund managers continued to believe in the company’s blue-chip status and future prospects. Throughout 2015 they continued to buy the shares aggressively every time they showed any sign of weakness.
This gave rise to what technical analysts call a “descending triple top” – which is probably about the most bearish formation that can occur on any chart. It is a clear sign that insiders, with privileged information about the progress of the business, are selling their shares as quickly as possible but in a controlled manner so as not to “spook the market”.
As a private investor you need to take note of the fact that the share, although still rising, became increasingly volatile throughout 2013 and 2014. This was the clue that all was not well. Then it reached a top in late 2014 which, despite substantial institutional patronage, was never exceeded. The accumulated momentum of institutional buying caused the share to test that top on at least two more occasions in early 2015, but in each case the share was unable to rise above the previous top and fell back on strong insider selling.
Finally, in June 2015, the truth became apparent, after the third lower top and the share collapsed. After this collapse there was an extended 4-year period between the end of 2015 and the end of 2019 when fund managers continued to believe that somehow the share was “cheap” and would recover its erstwhile blue-chip status. The last thing to die in the share market is hope…
All hope ceased in February and March 2020 with the advent of COVID-19. The company was very badly placed to manage this black swan event because of its extremely high debt levels and the share collapsed again.
In July 2023, the company began to turn itself around with a new CEO in the form of Phil Roux who replaced Erik Smuts at the helm. The radical steps he has taken and is taking mean that the company is once again on the mend. The debt has been restructured and significantly reduced. Working capital has been brought under control and costs have been cut. A rights issue to raise a further R1billion is planned to reduce debt even further.
The upshot of all these actions was that the share price was trading well below the company’s true inherent value. For this reason, we added it to the Winning Shares List (WSL) on 26th July 2023 at a price (after for the 250-for-1 consolidation) of 18600c. In the following 24 days, to its close on Friday last week, it has risen over 45% to 27100c.
What is important is that you understand the chart pattern that Nampak followed. The descending triple top followed by a collapse and an extended sideways/ downwards trend and then a final collapse - is a pattern that you, as a private investor, must understand. Consider the example of Steinhoff (SNH). This share made a high of 9685c on the 31st of March 2016, a descending triple top, an initial collapse, an extended period of sideways/downward movement and then a final collapse (in this case precipitated by the resignation of Markus Jooste). Consider the chart:
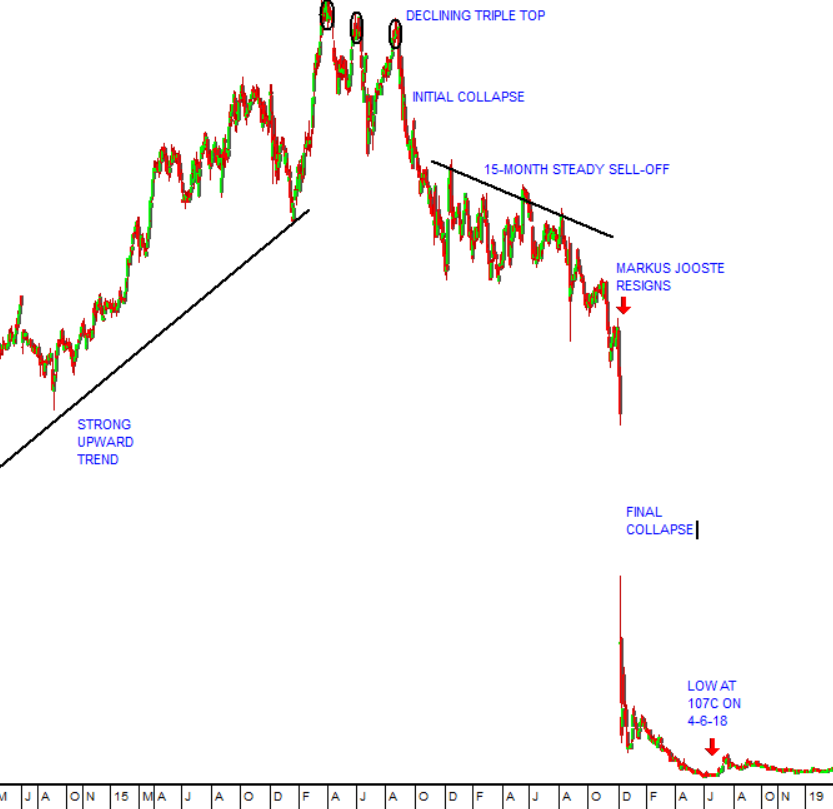
The difference, of course, is that Steinhoff was never going to recover because it admitted to a fraud which resulted in insurmountable litigation and further debt.
DISCLAIMER
All information and data contained within the PDSnet Articles is for informational purposes only. PDSnet makes no representations as to the accuracy, completeness, suitability, or validity, of any information, and shall not be liable for any errors, omissions, or any losses, injuries, or damages arising from its display or use. Information in the PDSnet Articles are based on the author’s opinion and experience and should not be considered professional financial investment advice. The ideas and strategies should never be used without first assessing your own personal and financial situation, or without consulting a financial professional. Thoughts and opinions will also change from time to time as more information is accumulated. PDSnet reserves the right to delete any comment or opinion for any reason.
Share this article: