Momentum in Charts
13 November 2023 By PDSNETWhen you throw a tennis ball high into the air, before it reaches its highest point, it begins to slow down – it loses upward momentum. The same principle applies in the progress of a chart.
When a new upward cycle commences, it usually comes after a protracted downward trend and initially there may be considerable buying energy. That energy manifests in the form of break-away gaps where the opening price of one day is noticeably above the previous day’s high creating a gap in the chart. The number and size of the gaps is an indication of how much buying enthusiasm remains in the market.
Of course, as the chart moves higher, there is less and less incentive to buy and more and more incentive to sell. After a time, as the bullish and bearish sentiment come more into balance, the gaps disappear and the rate at which the chart is climbing begins to slow noticeably. In other words, it loses upward momentum. This is usually a sign that the cycle is nearing its end.
The trend flattens out and then turns down, but if you are alert and notice declining momentum you can generally anticipate the downturn before it arrives. Indeed, momentum is the only technical indicator that can give an early warning of the top of a cycle.
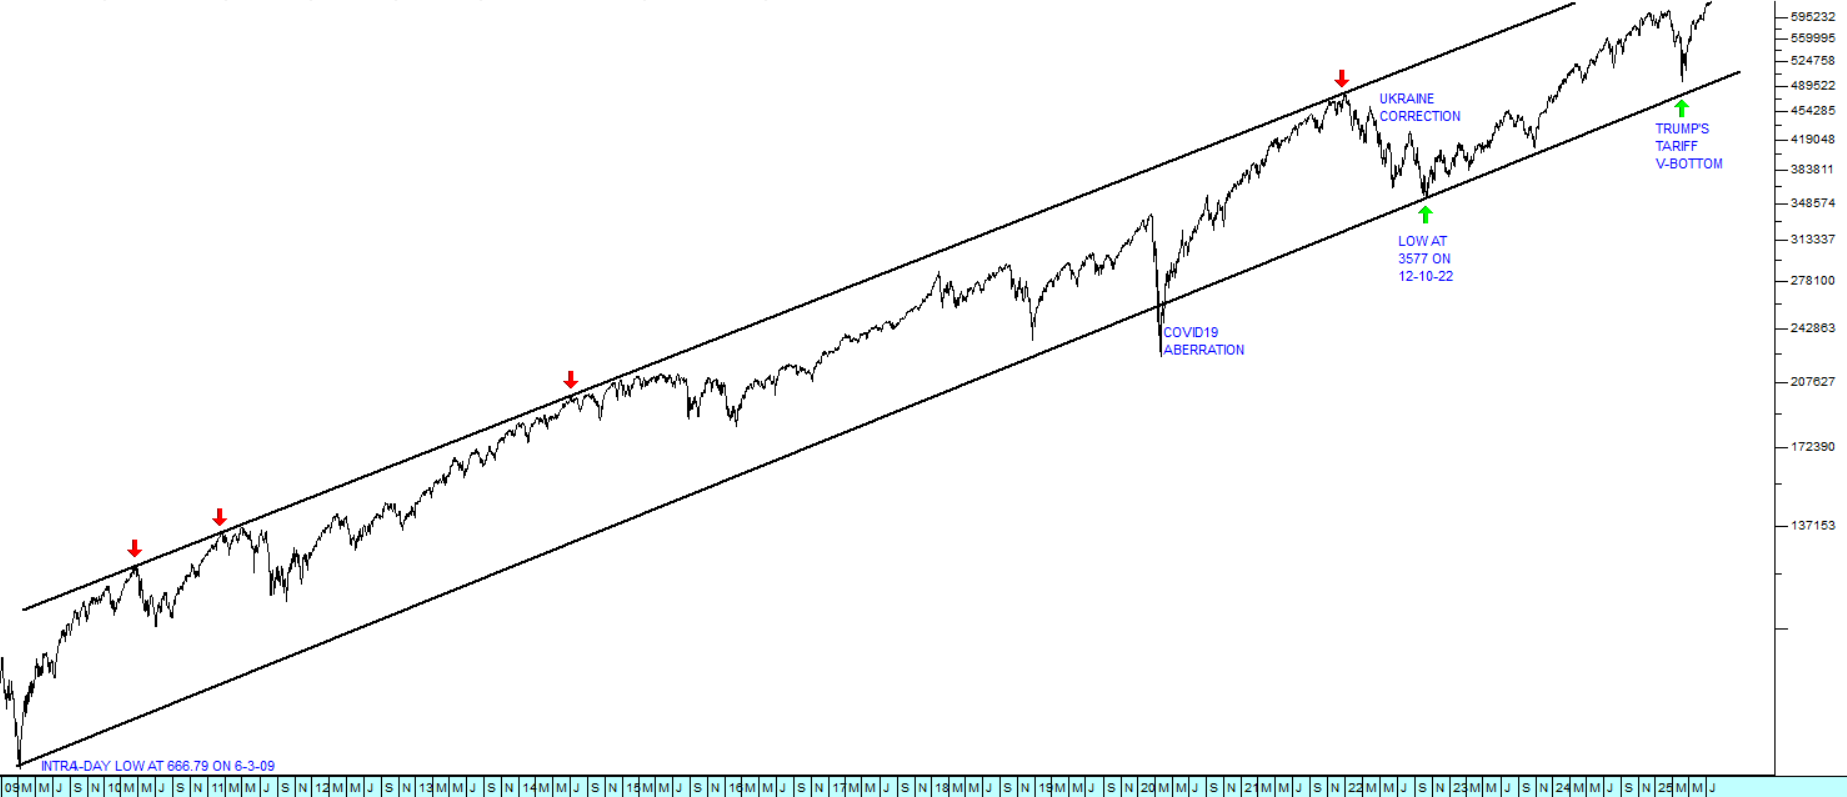
Consider the following chart of the S&P500 index from Wall Street over the past four months:
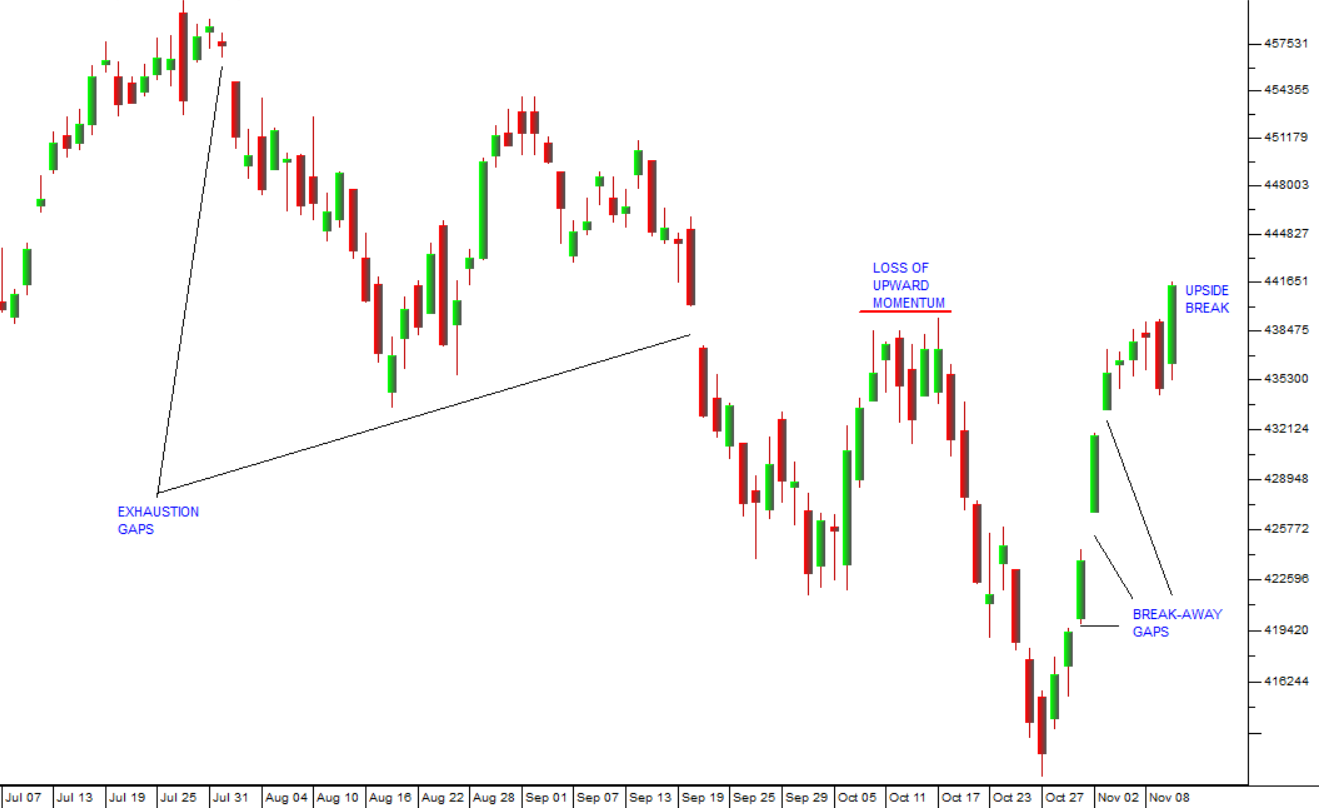
The chart shows the anatomy of the downtrend so far and highlights the exhaustion gaps and break-away gaps. An exhaustion gap is the opposite of a break-away gap and occurs when bullish investors disappear completely and the chart gaps down to a new low level.
The chart also shows the place at the top of the recent cycle where the S&P lost momentum. You can see clearly how the upward trend slowed down between 10th and 17th October (horizontal red line) – a clear indication of the coming downward trend.
One of the primary drivers of the current upward move on Wall Street has been the strong performance of Microsoft (MSFT). This company has a market capitalization of almost $3 trillion and accounts for about 2,5% of the S&P500 index, making it the most valuable company on Wall Street. Last week alone it rose 7% on the back of its increasingly dominant position in the development of artificial intelligence (AI). The share gained strongly following the release of its first-quarter earnings reported on 24th October 2023 which was ahead of estimates on the top and bottom lines and posted strong growth in its Azure cloud infrastructure division. It outperformed other cloud and AI competitors like Alphabet and Amazon.
Microsoft and other tech companies drove the 1,56% jump in the S&P last Friday. AI is expected to improve the profitability, not just of tech companies but of all companies as they implement this new efficiency and gain productivity as a result.
DISCLAIMER
All information and data contained within the PDSnet Articles is for informational purposes only. PDSnet makes no representations as to the accuracy, completeness, suitability, or validity, of any information, and shall not be liable for any errors, omissions, or any losses, injuries, or damages arising from its display or use. Information in the PDSnet Articles are based on the author’s opinion and experience and should not be considered professional financial investment advice. The ideas and strategies should never be used without first assessing your own personal and financial situation, or without consulting a financial professional. Thoughts and opinions will also change from time to time as more information is accumulated. PDSnet reserves the right to delete any comment or opinion for any reason.
Share this article: