Liberation Day
Trump has done the unthinkable. He has deliberately engineered the collapse of the US and world stock markets in the nonsensical belief that somehow an international trade war will make Americans richer. Nothing could be further from the truth. His actions have taken the S&P down from its all-time record high of 6144.15 on 19th February 2025 to Friday’s close at 5074.08 – a fall of 17,4% in just over 6 weeks.
The S&P has fallen a whopping 10,5% in just two days because, unsurprisingly, China has retaliated by imposing a 34% tariff on US exports to that country – which mainly consist of agricultural products.
The best indication of just how asinine Trump’s moves are is apparent in the formula which he has used to “calculate” the appropriate tariff for each country. It was:
50% of (exports to the US – imports from the US)/exports to the US
Thus, for example, Vietnam exported $136bn to the US last year and imported $13bn worth of goods from the US.
This means that their tariff is roughly (136 - 13)/136 X 0.5 = 45%
This clearly shows that despite his much-flaunted “business expertise”, Trump does not understand how international trade works. Most importantly he does not grasp that free trade benefits everyone and that any government interference with it comes at a cost – which usually takes the form of inflation. Economists across the political spectrum are describing Trump’s tariffs as “chaotic”, “shambolic” and demonstrating that he has a “kindergarten understanding of international trade”.
The simple fact is that all countries are good at producing some products and bad at producing others for a variety of reasons such as climate, mineral resources, locations and skills. It therefore makes sense for countries to trade what they are good at producing for those products that they are less efficient at producing.
Thus South Africa needs to import technology products while the US needs to import platinum group metals and chrome. Both countries benefit from this exchange. And the exchange does not necessarily have to be equal. If South Africa exports a greater value of its metals and minerals to America than the value of American products that it imports, that gives it a trade surplus which it can then use to buy products from a third country which has a trade deficit with America.
Trade surpluses are not debts owed by one country to another (as Trump appears to believe). They simply indicate a paper imbalance which is inevitably resolved by that country’s trade deficit with another country. The complexities of international trade are best left to the companies which regularly buy and sell products across borders. Governments cannot and should not try to regulate this flow of goods.
So where does that leave us now? Well, the danger is that an international trade war between the US and countries outside the US is likely to significantly reduce global business activity – leading to a recession. If retaliatory “tit-for-tat” tariffs are pushed too far they could even result in an economic depression. That is why the stock markets are falling.
Investors now fear, with good reason, that the US economy will fall into a recession later this year. Already, the Atlanta Federal Reserve Bank is predicting that the US economy will shrink by 3,7% in the first quarter of 2025.
So now the question is, “Where does this leave markets?”
To get some kind of line on how far down markets will go, we need to consider the long-term chart of the bull market on the S&P500 index. Consider the chart over the past 16 years:
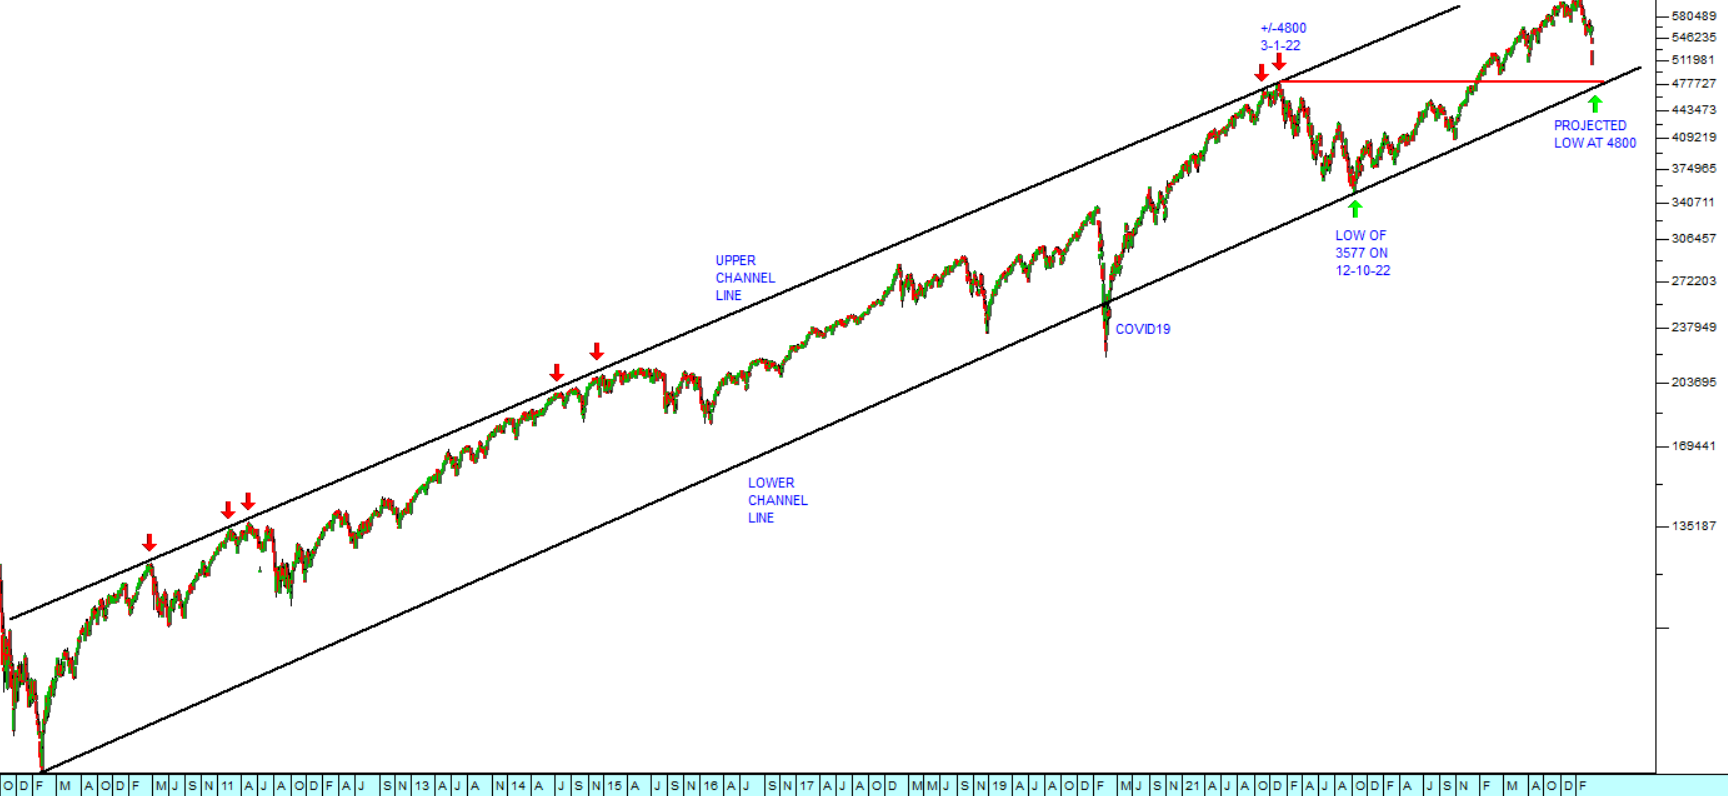
The chart shows that, aside from the COVID-19 aberration in 2020, the bull trend has been in progress for the past 16 years, operating between an upper and a lower channel line. The upper channel line is supported by multiple “touch points” (the red arrows) including the high on 3rd January 2022 when it reached 4796.
The lower trend line begins with the start of the bull trend on 9th March 2009 when the S&P reached a closing low of 676,53. Ignoring the COVID-19 spike the S&P500 finds another low after the exceptional 25% correction of 2022, when it made a low of 3577 on 12th October.
What is notable is that despite the time period covered by this channel, the two channel lines are parallel. This gives then considerable long-term technical validity in our opinion.
The point is that if we project the likely low point for the current downward trend, it should be when the S&P reaches approximately 4800 and touches that lower channel line again. This would mean that it would have fallen 21,8% from its all-time high. It would also mean that we should expect a further fall of about 270 points or another 5,4% before this bloodbath is over.
What would cause the downward trend to reverse? At this point only some sort of back-tracking by Trump on his announced tariffs could do this – and we remain hopeful that as the pressure on him to increases he will be forced to retract at least to some extent and with some countries.
When the S&P gets close to the 4800 level, then we should begin looking for a point of “capitulation” where most ordinary investors have just completely given up on the stock market and simply want to be out of it. For the brave that will represent a buying opportunity.
Of course, through all of this it is essential that you maintain a strict stop-loss strategy. Predicting markets like this and predicting the future actions of someone like Trump is at best guesswork. So, you always need to have a safety net in place to protect the bulk of your capital.
We still do not believe that this is the beginning of a major bear trend because the underlying fundamentals of the US economy remain positive – but we have been wrong in the past and we can be wrong now.
← Back to Articles