Institutional Blindness
12 April 2019 By PDSNETThe Business Day reported on 10th April 2019 on the Investment Forum in Sandton where several asset managers talked about the major share collapses of the past three years – most notably Steinhoff, EOH and Tiger Brands. The big institutions and major fund managers (like Alan Grey, PSG and Coronation) lost hundreds of billions of rands when these stock market “darlings” suddenly collapsed. But in each of these cases, there was clear technical evidence that all was not well long before they collapsed.
STEINHOFF
In the case of Steinhoff, the share made a perfect declining triple top at least 15 months before the Viceroy report came out and caused the share to collapse. Consider the chart:
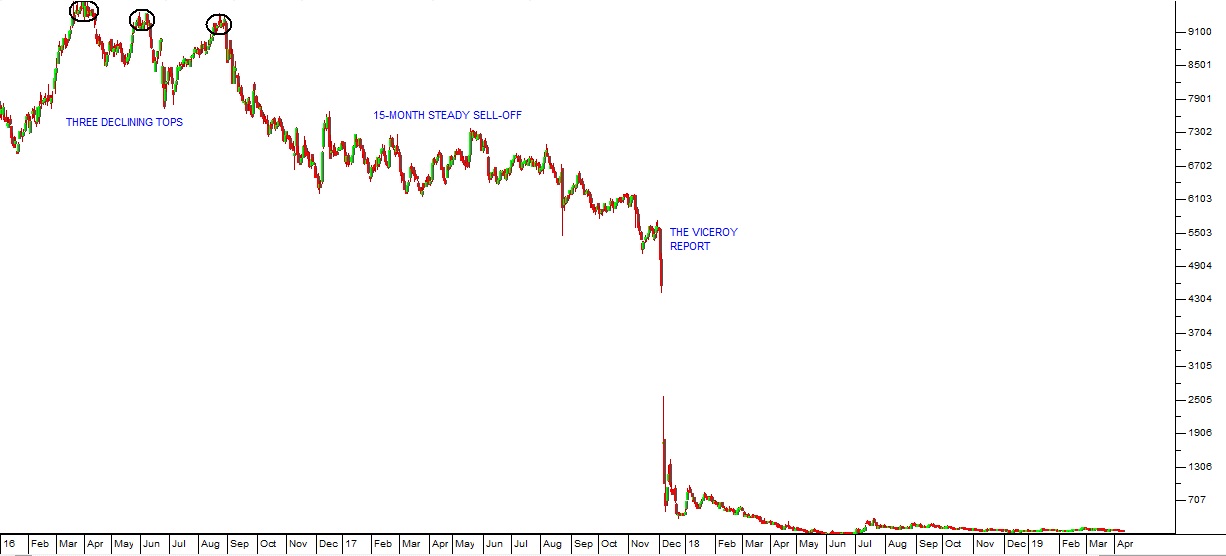
Here you can quite clearly see that the descending tops in March, June and August 2016 showed quite clearly that someone big was off-loading Steinhoff long before the Viceroy report came out. But the big institutions and the fund managers continued to patronize the share for the next 15 months in which time it declined steadily. This was technical insanity.
TIGER BRANDS
The Tiger share price completed a perfect head-and-shoulders formation immediately before its troubles became public and the share fell. Consider the chart:
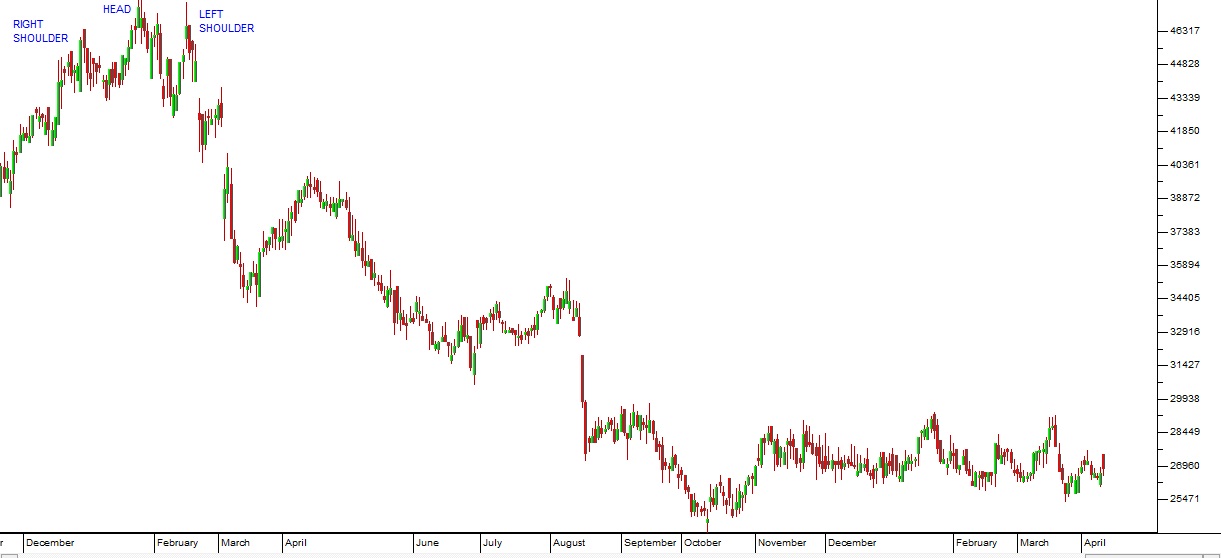
A head-and-shoulders formation like this is a clear indication of a severe downward trend. Anyone paying attention to the formation would have sold the share out in February 2018 at the latest at a price of around R426. Its subsequent collapse took the share down to current levels around R270
EOH
EOH was the absolute darling of the stock market and institutional fund managers until the end of 2016. But it clearly signaled its impending doom through a “double top” formation – followed immediately by a third “failure” top. Consider the chart:
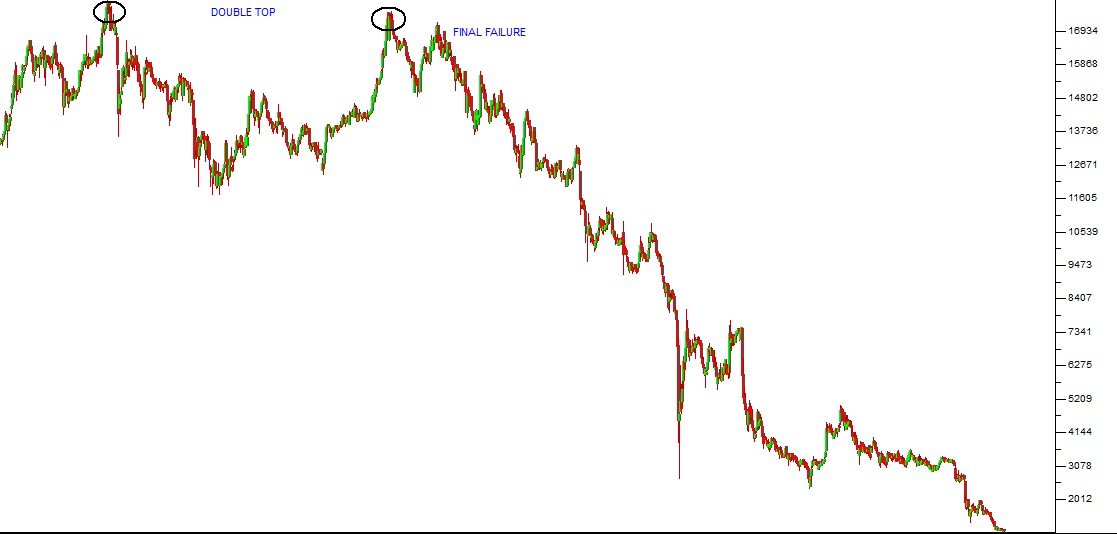
The two tops are separated by almost a year – but the fact that the second top at the end of September 2016 failed to break above the first top of August 2015 was a technical disaster. The final failure came a few months later when the share once again made an attempt to break upwards and again failed. Nobody in their right mind should have been buying the share at this point. Anyone who was watching the chart would know that something really bad was going wrong. In each of these examples, there were insiders (whose names we will never know) who became aware of the problems in the company long before those problems became public knowledge. They acted on that understanding by selling their shares – which is what led to the formations displayed above. The important point to grasp is that there are always people who have inside information and who will act on that information. Their actions are always clearly visible in the chart formations. If you pay attention to those formations you can save yourself a great deal of heart ache. The fund managers who have consistently and continuously rubbished the use of technical analysis should also re-consider their foolishness. The secret is not to sift endlessly through published company documents looking for “poor governance” or other signs like “structural issues” or “charismatic CEOs” – rather the clues are in the share’s price chart and are glaringly obvious once you know what to look for. It is notable that nobody present at the Sandton conference even mentioned technical analysis – which probably means that they will all make the same mistakes and lose even more money when the next “blue chip” collapses.
DISCLAIMER
All information and data contained within the PDSnet Articles is for informational purposes only. PDSnet makes no representations as to the accuracy, completeness, suitability, or validity, of any information, and shall not be liable for any errors, omissions, or any losses, injuries, or damages arising from its display or use. Information in the PDSnet Articles are based on the author’s opinion and experience and should not be considered professional financial investment advice. The ideas and strategies should never be used without first assessing your own personal and financial situation, or without consulting a financial professional. Thoughts and opinions will also change from time to time as more information is accumulated. PDSnet reserves the right to delete any comment or opinion for any reason.
Share this article: