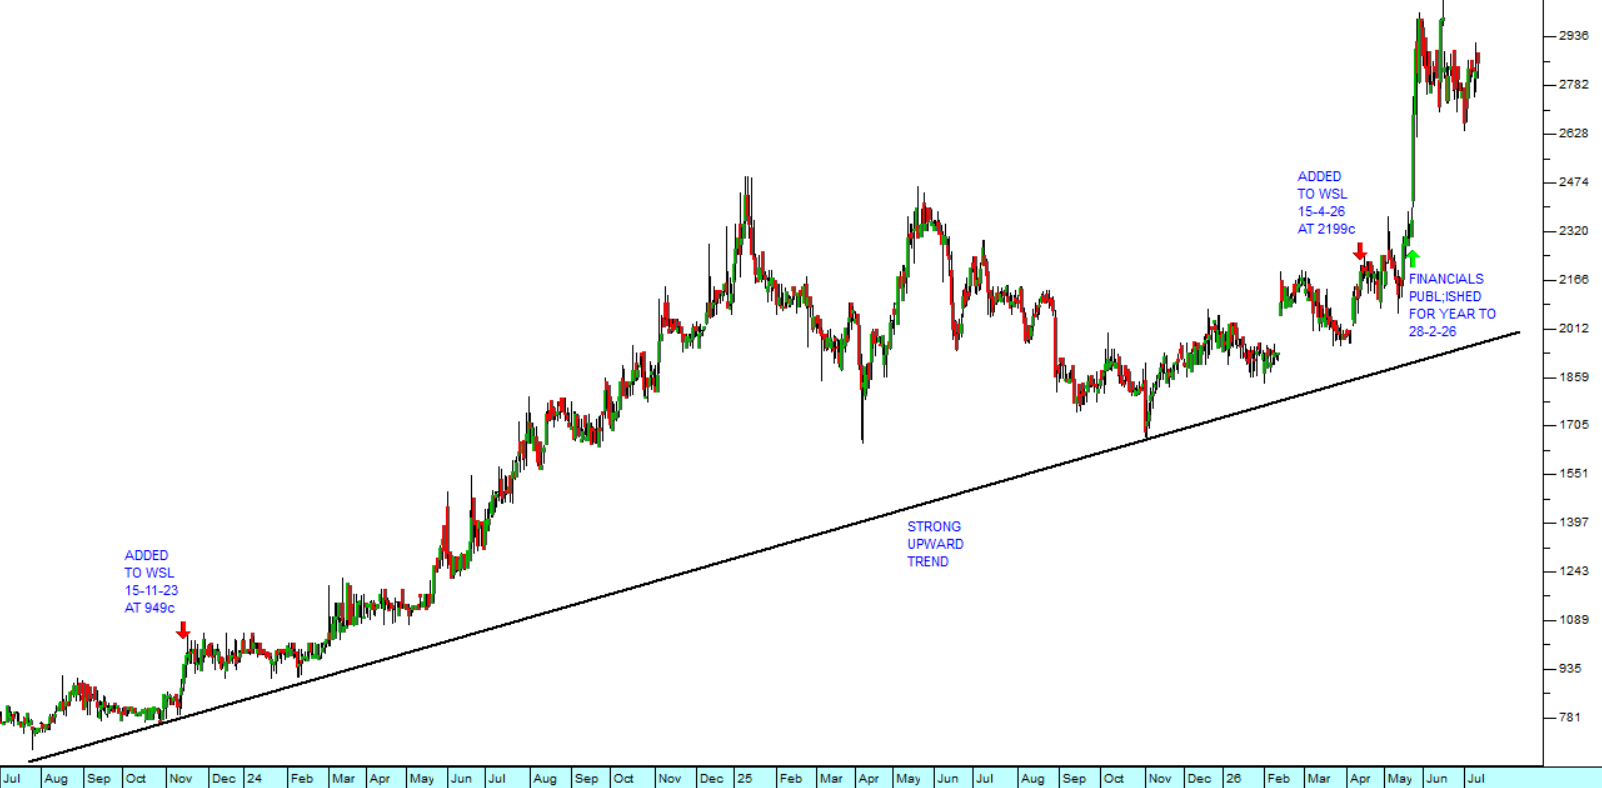
Altron is one of the best companies listed on the JSE and a long-time favourite of ours. We first added it to the Winning Shares List (WSL) back in November 2023 when the share was just 949c. Just over 2 years later in January 2025 it reached a high point of 2439c (10-1-25). After that it moved sideways for the next sixteen months and we only again became interested in it following its trading statement published on 12th February 2026 where it predicted that the headline earnings per share (HEPS) from on-going operations would increase by at least 30%.
After an investigation we decided to again add it to the WSL on 15th April 2026 at a price of 2199c. That was just 3 months ago, and the share has since gone up by an impressive 30% - which equates to about 125% per annum. Consider the chart:
 Altron (AEL) : July 2023 - 10th of July 2026. Chart by ShareFriend Pro.
This story is an object lesson in paying attention to the messages which listed companies regularly post on the Stock Exchange News Service (SENS) especially their trading statements. In a trading statement the board of directors give their best assessment of what the company’s HEPS will be in its next set of financial statements.
In Altron’s case their first trading statement was published more than 3 months before its financials came out on 25th May 2026. This gives the active private investor plenty of time to investigate thoroughly and even to visit the companies place of work and try to speak to one of its directors.
When the results finally came out, the share price shot up because they were truly exceptional in a number of respects. Firstly, HEPS from continuing operations rose by a solid 34% and secondly the company showed that they were completely debt-free and had more than R1bn in cash in the bank. As soon as the institutional fund managers saw those points and various other strong ratios in the company’s financials they immediately began buying up as many shares as they could lay their hands on. The result is that the share rose to a new record high of 3005 on 15th June 2026. Since then, it has been moving sideways.
My point is that everything that I have said in this article was in the public domain and you could easily have taken advantage of it. Hopefully, some of you did. The JSE regularly provides excellent highly profitable investment opportunities for those private investors who are willing to a little homework. Your Share Friend software gives you a complete up-to-date list of all the SENS messages published by every listed company every day. All you need to do in Share Friend is hold down the Alt key and press the letter “S”.
Follow-up
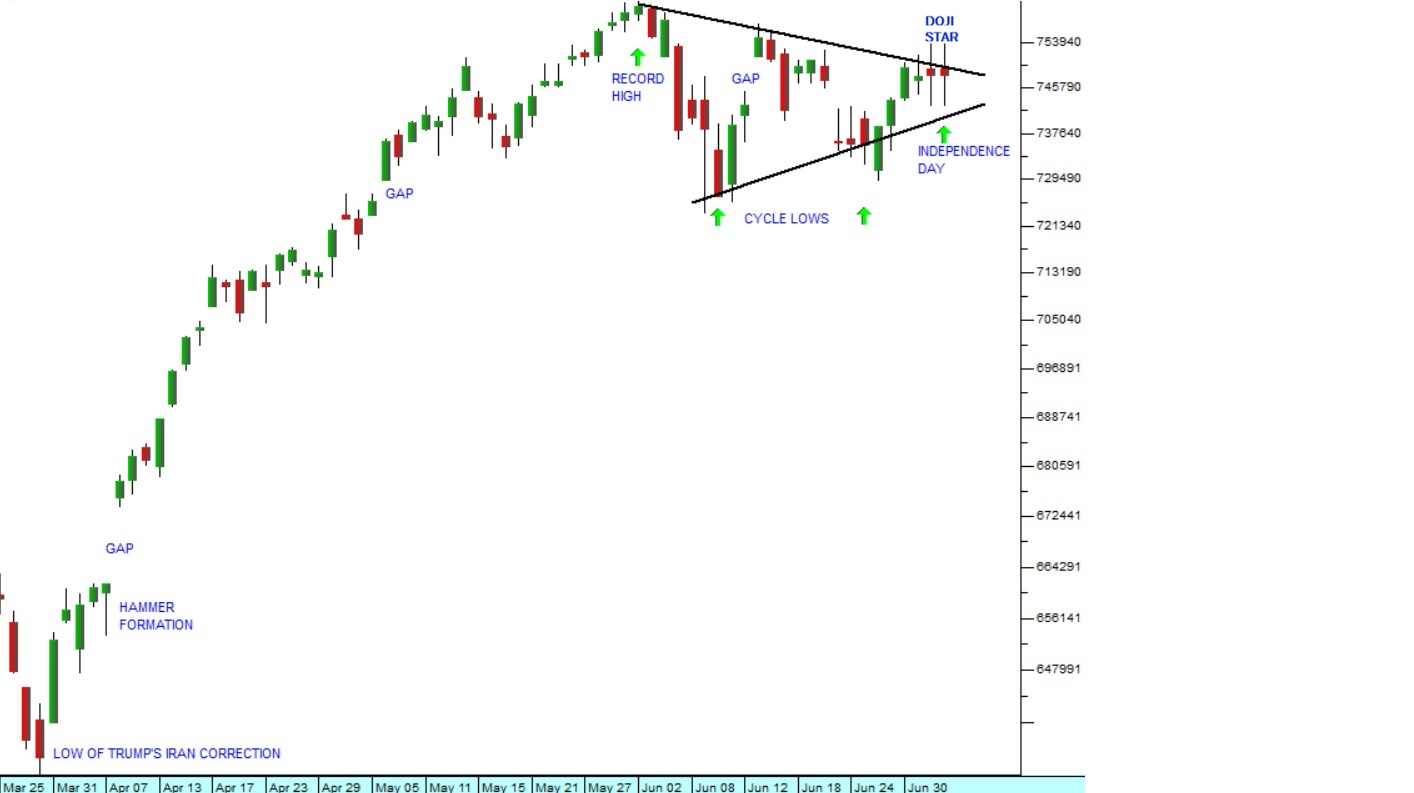
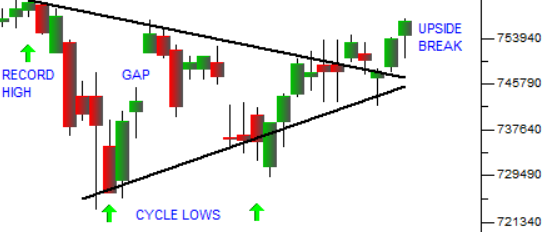
In last week’s article on candlestick charting as it is applied to the S&P500 index, I drew attention to the fact that the S&P was in a triangle formation and I suggested that it would almost certainly break out of that formation to the upside fairly soon. Well, it has now done that. Look at the chart:
 S&P500 Index : 2nd June 2026 - 10th of July 2026. Chart by ShareFriend Pro.
In our view it will almost certainly now break to a new all-time record high very soon.
The most notable observation of the week was just how little the oil price went up when Trump decided to resume his bombing of Iran and the Strait of Hormuz was once again closed. Clearly the world economy and the stock market have moved on and the Strait can no longer influence the oil price or the world economy as it did in February.