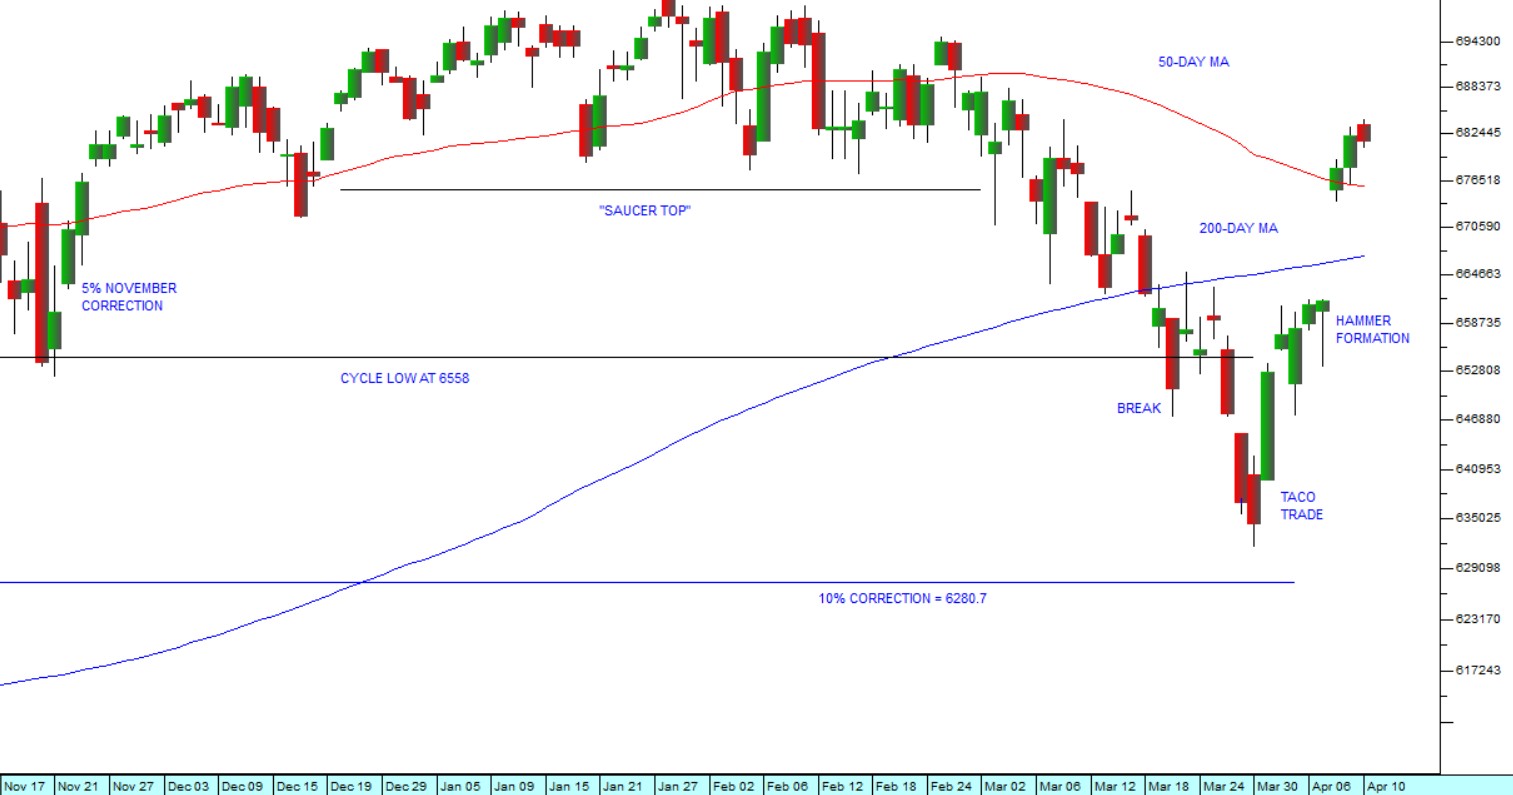
Now that the TACO trade associated with Trump’s war in Iran is over and markets are again posting new all-time record highs, it is worth noting that the JSE has not yet recovered completely and the JSE Overall Index (J203) is still 5,6% below its record high of 128456 made on 27th February 2026.
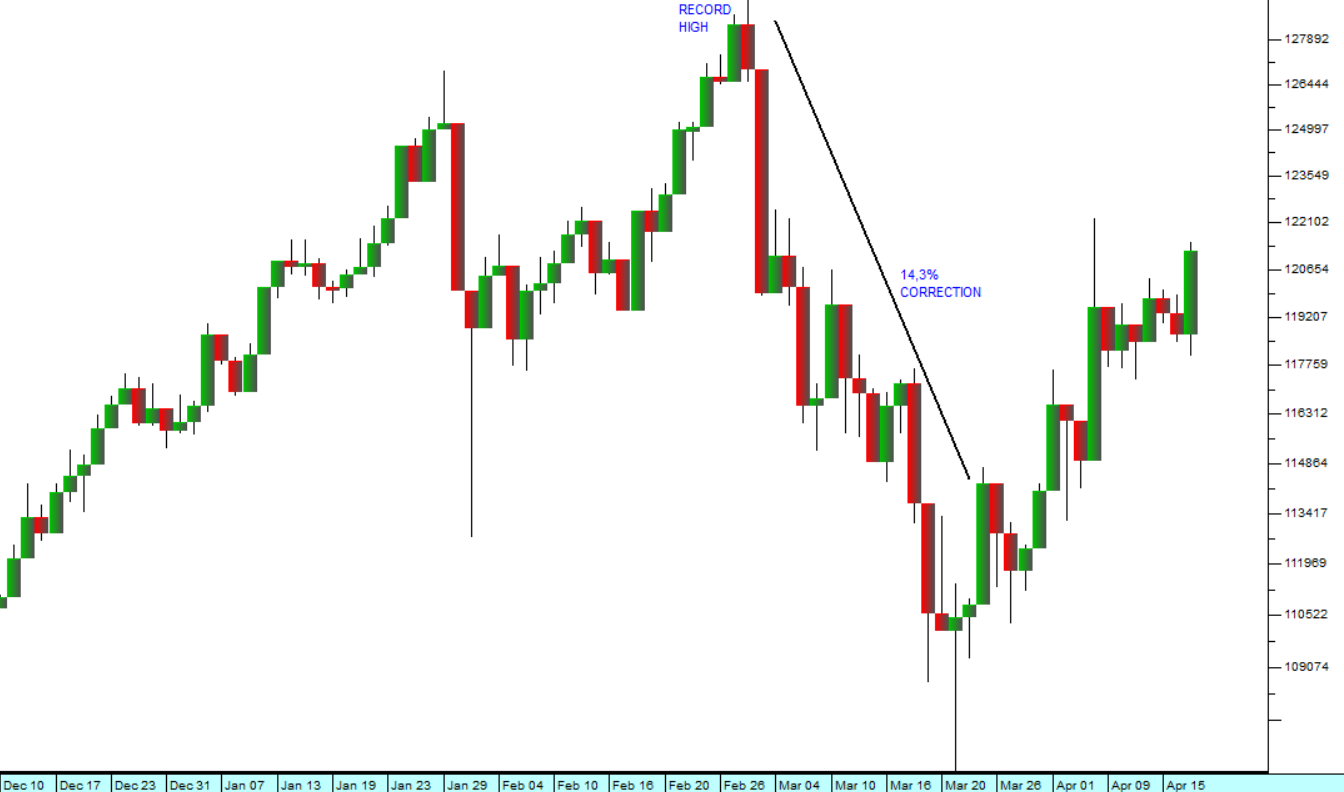
As an emerging market, the JSE always tends to be more volatile than first world markets – which means it falls further and goes higher. The JSE fell a total of 14,3% during this correction where the S&P500 fell by only 8,8%. It is also important to understand that the markets of the world (including the JSE) always tend to follow Wall Street – so we should expect the JSE Overall index to break to a new record high fairly soon. Consider the chart:
 JSE Overall Index : 10th of December 2025 - 17th of April 2026. Chart by ShareFriend Pro.
Our Winning Shares List (WSL) is still dominated by commodity shares like Sasol, Pan African, Southern Palladium and Anglogold, so there are still investment opportunities to be found among the blue-chip industrials and financials.
One such blue chip is PSG Financial Services (KST). KST has been spun out of PSG which has spawned many very successful JSE listings like Capitec, and Curro. KST is a thoroughly South African company that has a long track record of excellent performance.
Its business consists primarily of asset management and insurance. In its results for the year to 28th February 2026 the company reported R540bn of assets under management (AUM), up 20% from the year before. It also reported its gross written premiums up 5% to R8bn. The company’s core income increased by 22% to R8,28bn and its recurring headline earnings per share (HEPS) rose by a whopping 34%. These are excellent results. Consider the chart:
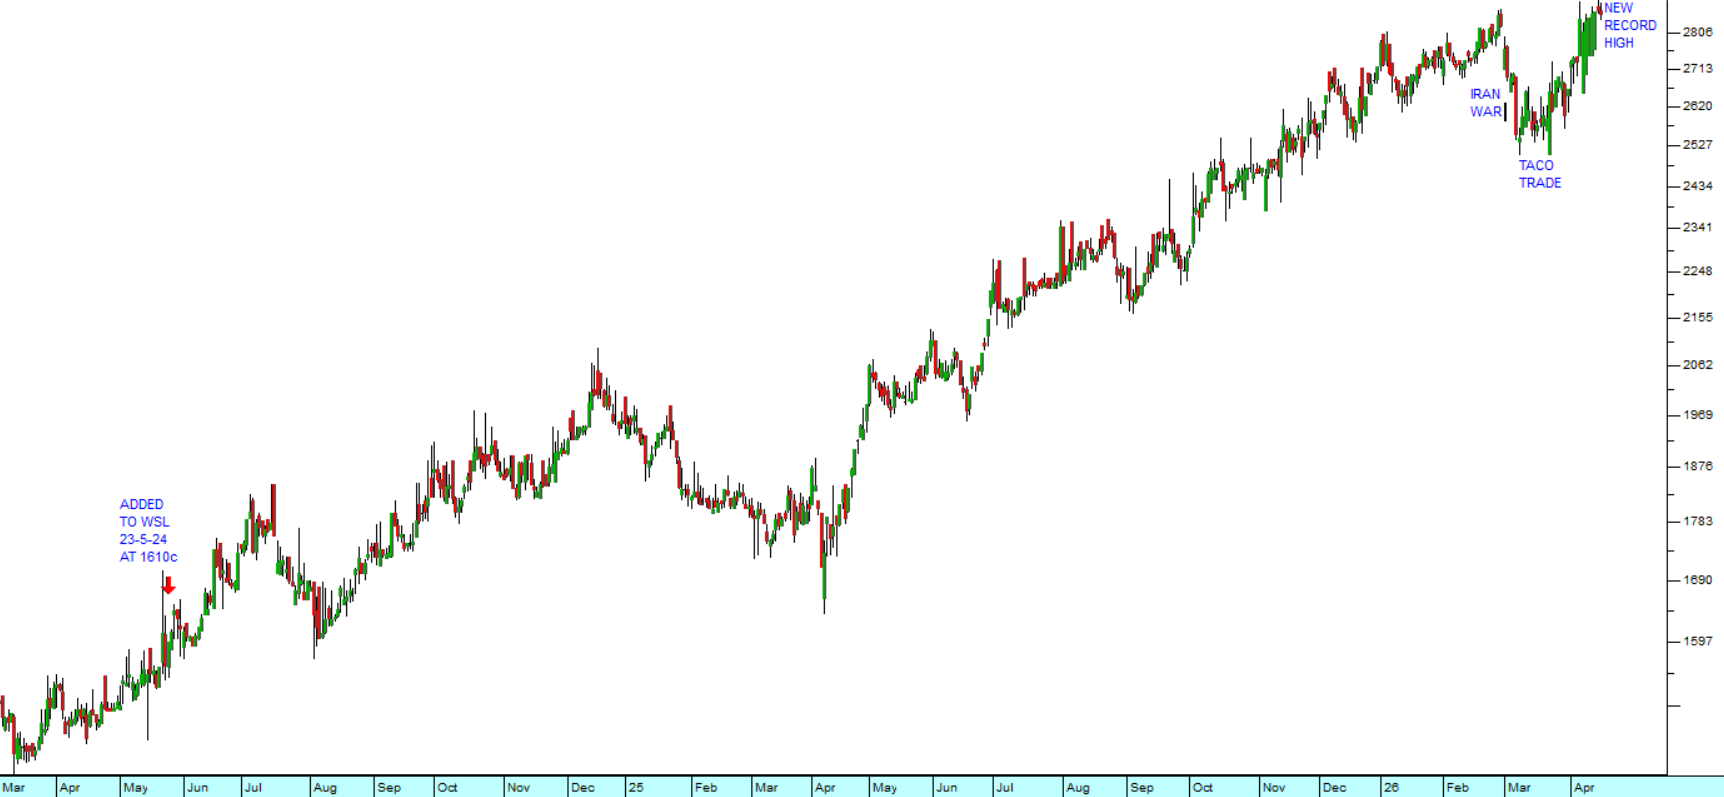 PSG Financial Services (KST) : March 2024 - 17th of April 2026. Chart by ShareFriend Pro.
KST has been in a steady upward trend since March 2024. We added it to the Winning Shares List (WSL) on 23rd May 2024 at 1610c and since then it has nearly doubled to 2865c.
Like most blue-chip shares trading on the JSE, KST shares fell as a result of the war in Iran and the sharp rise in the price of oil. That sell-off gave private investors a rare opportunity to buy further in to this excellent company.
As a private investor it is important to understand that KST is a services company and has an insignificant working capital requirement, while much of its income is annuity income. Its staff are also highly educated and paid – which means that they are not unionised. Given its long track record of generating profits, this makes it an almost risk-free investment.
Of course, we are not the only ones who are aware of KST’s great performance. The institutional fund managers have long favoured its shares and as a result the shares trade for a relatively high P:E ratio of 21,22 – which compares with the JSE Overall indexes average P:E of 15,34. Nonetheless, it is a good share to accumulate during periods of weakness.