Market View
J200 100,698.00 -0.85% J203 108,515.00 -0.82% J210 116,474.00 -2.29% J211 119,106.00 -0.08% J212 24,842.00 -0.22% J213 133,600.00 -0.07%
Winning Shares (Top 5)
Code Name Added Price Latest % Gain % Gain/Year
AGL ANGLO 2025-09-10 58888 89192 +51.46% +47.08%
SDL SOUTH-PD 2025-09-09 725 1865 +157.24% +143.48%
HYP HYPROP 2024-08-15 3439 6044 +75.75% +35.00%
EQU EQUITES 2025-05-01 1515 1837 +21.25% +14.61%
TKG TELKOM 2024-11-16 2884 5258 +82.32% +43.11%
Opinions (Top 5)
Code Name Date Action
VUN VUNANI 2026-10-15 View

Vunani (VUN) is a black-owned financial services group with interests in asset management, investment, banking, property and stockbroking. It also has an interest in coal mining which has been performing well with the rise in coal prices. In its results for the year to 28th February 2026 the company reported revenue up 17% and headline earnings per share (HEPS) of 10,2c compared with a loss of 2,8c in the previous period.

The company said, "The group generated total comprehensive income for the period of R35.3 million (2025: total comprehensive loss of R3.4 million), while total profit attributable to equity holders of the company amounted to R9.6 million". In a trading statement for the six months to 31st August 2026 the company estimated that HEPS will increase by between 52% and 72%.

From a private investor's perspective, the biggest problem with this share is that it is too thinly traded to be a practical investment. 

IOC IOCO 2026-10-15 View

15-10-2026   Previously called Enterprise Outsourcing Holdings (EOH), Ioco was Africa's largest information technology company with involvement in almost every aspect of computer applications. At one point the company had 11000 staff members, but that has now been reduced to 6151.

It was, until August 2015, the darling of the JSE because it had a long track-record of steadily improving profits. It made a peak of R178 per share at a P:E of 35. An unsuccessful attempt to exceed that high (i.e., a double top) came a year later in September 2016 and since then the share has fallen steadily to reach a low of 146c in February 2023.

This fall was initially accompanied by allegations that the company was involved in and owed its success to state capture in collaboration with the Guptas. The CEO and founder, Asher Bohbot, resigned in May of 2017 and handed over to Zunaid Mayet, who handed over to Stephen van Coller.

Usually, when a company is run by a strong charismatic leader and that leader (like Bhobot) resigns, it is time to sell the share. The company's 200 subsidiaries have been consolidated into three divisions with centralised debt collection and procurement. On 6th July 2021 Business Day reported that EOH could possibly be "blacklisted" by the government as a result of its past tender frauds.

This would obviously be very negative for the company. On 11th November 2022, the company announced a R500m rights issue and a R100m private placement mainly to reduce debt and on 13th February 2023 it announced that the offer had been 135,8% over-subscribed. On 31st May 2024 the company announced the resignation of various directors and the appointment of Marius de la Rey as interim CEO.

In its results for the year to 31st July 2026 the company reported headline earnings per share (HEPS) up 42% and net finance costs reduced by 32%. The company expects to deliver the following in 2027 (1) EBITDA of at least R680 million (2) Improving cash generation and conversion (3) Recurring revenue in excess of 60%.

Technically, the share made a "double bottom" in April and May of 2024 after which it began a new upward trend. We believe that it will continue rise. It was added to the Winning Shares List (WSL) on 6th November 2024 at 220c and subsequently rose to a high of 468c on 26th January 2026.

Since then it has been moving sideways and downwards, but we believe it will continue to rise in due course. On the 14th of February 2025 the company announced that Marius de la Rey had resigned with immediate effect. Directors Rhys Summerton and Dennis Venter have been appointed as joint CEO's and executive directors.

NY1 NINETY-1L 2026-10-14 View

14-10-2026   Ninety-One is an asset management company spun out of Investec and separately listed on Monday 16th March 2020. The listing occurred just as the corona epidemic was causing world stock markets to crash so the shares fell more than 40% below their pre-listing range on the first day.

There was no initial public offer (IPO). In our view this massive blue chip share is significantly under-valued at current levels. The company's employees now own 22,5% of its equity.  Obviously, this company's performance was impacted by the decline in equities since the pandemic - but the value of its assets under management (AUM) was rising as markets around the world recovered.

In its results for the year to 31st March 2026 the company reported assets under management (AUM) up by 31% to GBP171,8bn and headline earnings per share (HEPS) up 2%. The company said, "The demand recovery for emerging markets is visible and our offering competitive. We are in a stronger position than a year ago".

This share is directly impacted by the direction of the trend on Wall Street and world markets. Technically, the share entered a downward trend in February 2026 and may now represent a buying opportunity on a P:E of 10,27 (13/10/2026). The company confirmed its assets under management at the 30th September 2026 at GBP181,4 billion compared to GBP171.8 billion on the 31st of March 2026.

Over the past year the Sanlam UK active asset management business has been taken over by Ninety One adding GBP18,3bn to its AUM. 

THA THARISA 2026-10-14 View

Tharisa (THA) is a mining company that mines and beneficiates platinum group metals (PGMs) and chrome. The company is listed in London and on the JSE. The Tharisa mine on the south-west limb of the Bushveld Igneous Complex (BIC) is an open pit operation with an estimated life of 17 years.

The company owns a subsidiary, Arxo Metals, which beneficiates chrome to produce high-grade chrome concentrates. The company is planning to expand into the Great Dyke area of Zimbabwe. In our view, this is one of the best mining investments on the JSE with a cost of production which is well below current metals prices and some good options for expansion.

The company has been involved in the Vulcan Plant which will improve chrome recovery to 82% from 65% and cost $54,2m. The target is to reach 200 000 ounces of PGM's (platinum group metals) and 2m tons of chrome ore production using a proprietary technology. The open pit operation is relatively low cost and does not have the problems associated with underground operations.

The company is planning to build a 5MW furnace that will enable it to produce iron alloys which are rich in platinum group metals and would sell for a far better price. In its results for the six months to 31st March 2026 the company reported revenue up 28% and headline earnings per share (HEPS) up 472,4%.

The company said, "Our focused investment in underground development at the Tharisa Mine reflects our dedication to maximising resource longevity and responsible value creation. The advancement of the Karo Platinum Project in Zimbabwe is another milestone, reinforcing our diversified growth strategy and disciplined delivery on project development".

In an update on the 3rd quarter to 30th June 2026 the company reported PGM production of 39,6koz compared with 34,3koz in the previous quarter. The company said, "PGM production increased by 15.5%, supported by a marked improvement in recoveries to 83.8%, while chrome production remained steady despite lower milled tonnes".

In a production update for the 3 months to 30th September 2026 the company reported PGM production up 3,5% and chrome concentrate production up 5,8%. The company said, "Group cash on hand of US$123.6 million (30 June 2026: US$198.8 million), with additional escrow cash of US$288.2 million amounting to a combined total of US$411.8 million and debt of US$462.8 million (30 June 2026: US$188.1 million), resulting in a net debt position". Technically, the share is well traded.

The share had been rising since April 2025 but remains a risky commodity counter dependent on the international prices of the commodities which it produces. 

BYI BYTES 2026-10-14 View

13-10-2026   Bytes Technology was spun out of Altron and separately listed on the London Stock Exchange (LSE) and the JSE. At listing it had a market capitalisation of about R13bn which has subsequently grown to R26,5bn. Altron shareholders received GBP542m in shares and cash at the demerger in a significant release of value.

It describes itself as "...one of the UK's leading software, security and cloud services specialists." The company is the biggest reseller of Microsoft products in the UK and receives about 60% of its revenue in annuity form. In its results for the six months to 31st August 2026 the company reported revenue up 18,7% and headlline earnings per share (HEPS) up 6,1%.

The company said, "Strong balance sheet with closing cash of £68m and cash conversion of 45.7%, reflecting the normal weighting of our cash generation to H2, with £41m returned to shareholders in the half year including completion of the £25m share buyback". Technically, the share has been falling since its high of R161 on 25th January 2024.

We recommend waiting until it breaks up through its downward trendline before investigating further - and that has not yet happened, but appears imminent. The share began a new upward trend in March 2026 which appears to be gaining  momentum. This share is a solid rand-hedge and should perform well going forward. 

Winning Share: TKG
Opinion: IOC
Quantum Computing  (2026-10-12)

We live in an age where advances in technology are driving the gains in productivity and profits, and then being discounted directly into share prices. Artificial intelligence (AI) is already well established and being used by most companies to improve productivity. This can be seen in the results…

We live in an age where advances in technology are driving the gains in productivity and profits, and then being discounted directly into share prices. Artificial intelligence (AI) is already well established and being used by most companies to improve productivity. This can be seen in the results coming out of the companies in the S&P500 index. The impact of AI has only just begun to be discounted and now the next major technological breakthrough, quantum computing, is hovering in the background.

Quantum computing is essentially a jump forward in hardware which allows computers to analyse multiple different solutions simultaneously. Instead of using bits which are either 1 or 0, a quantum computer uses qubits which can exist in multiple states simultaneously - together with quantum entanglement. The technology uses the laws of physics at the atomic and subatomic level to solve complex problems much faster than regular computers, even supercomputers. Microsoft, Google, Amazon, Oracle, and even Meta and Tesla, are rushing to install quantum computing into their infrastructure. In a word, quantum computing will increase the power of AI substantially making it even faster and more powerful than it already is.

With that background, the earnings of S&P companies for the third quarter are beginning to trickle in, with 19 companies having reported so far. Total 3rd quarter earnings for those companies that have reported results already are up +150.9% from the same period last year on the back of revenues which are +27% higher. 79% of those companies are beating EPS estimates and 73.7% are beating revenue estimates.

The average estimate for all S&P500 companies is that earnings will be up by 24,3% in the 3rd quarter when compared with a year ago – and this will be the 8th straight quarter where estimates have been in positive double digits. 15 out of 16 sectors are expected to make significant gains – led by the technology and energy sectors.

As things stand now, the progress of the S&P500 index is being significantly held back by developments in Trump’s Middle East war and the price of oil. Iran would like to hold the price of North Sea Brent above $100 per barrel, at least until after the mid-term elections on 3rd November 2026 – which of course is very bad news for the struggling Republican party and Trump.

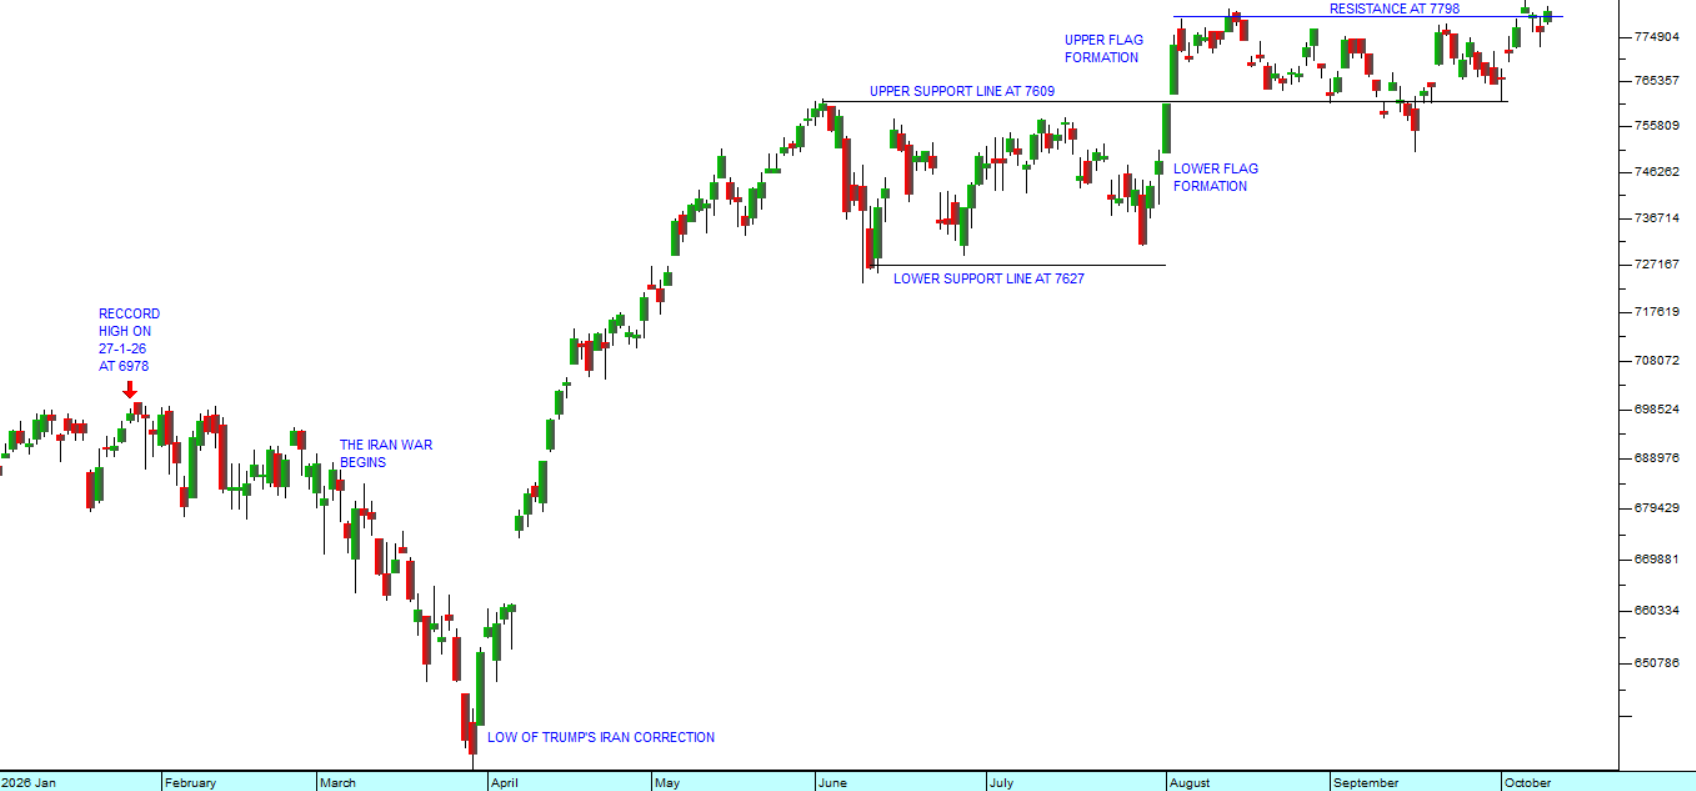
Looking at the chart, the S&P500 index has been moving through a series of protracted sideways markets for the past four months. During that time, technology and the prospects of that technology have not stood still. They have been advancing at a rapid pace.

Our belief is that as soon as the situation in the Middle East is resolved and the oil price comes back to where it was before the war began, the S&P will suddenly begin discounting the impact of the accumulated technical advances and move sharply higher. It will be like removing the lid from a pressure cooker. Consider the chart:

S&P500 Index : January 2026 - 9th of October 2026. Chart by ShareFriend Pro.

So, what we are saying is that considerable bullish potential has been built up by this war and its impact on oil prices. This can be seen from the fact that even with Brent at over $100 a barrel now, the S&P is still making new record highs, based on the exceptional estimates of 3rd quarter earnings and beyond.

There are, of course, those who believe that Brent is about to go much higher – like to $125 per barrel - given the escalation in Yemen with the Houthis and the attacks on the Saudi pipeline. But in our view the underlying direction of the oil price must be downwards as the world moves away from fossil fuels and towards renewables, especially solar.

To be safe, ensure that you have a strict stop-loss level for all the shares in your portfolio. That is the ultimate protection against unexpected downtrends and bear markets. Your absolute rule should be to never lose more than 15% on any share market investment ever – including your dealing costs. Sometimes it is difficult to achieve this, but provided you always choose shares which are free-dealing, it simply becomes a matter of self-discipline. And then if you are able to make several hundred percent on your winners, mathematically, you must be successful over time.


The Omnia Takeover  (2026-09-28)

Omnia is a manufacturer of chemicals used in agriculture (fertilisers), mining (explosives) and various industries. It operates primarily in South Africa, but its products are sold throughout Southern Africa and abroad. In its latest financial statements for the year to 31st March 2026 the company…

Omnia is a manufacturer of chemicals used in agriculture (fertilisers), mining (explosives) and various industries. It operates primarily in South Africa, but its products are sold throughout Southern Africa and abroad.

In its latest financial statements for the year to 31st March 2026 the company reported revenue up 6% and headline earnings per share (HEPS) up 21%. The company benefited in some ways from the war in Iran and the closure of the Strait of Hormuz because that restricted the flow of agricultural chemicals onto world markets resulting in higher prices. Omnia was able to pay a dividend of 470c for the year, plus a special dividend of 280c. During the year it also bought back and cancelled 187436 of its own shares at an average price of 6465c per share returning a further R12,1m to shareholders.

This is one of the companies that was very hard hit by the COVID-19 pandemic, and its share price fell to a low of 1536c in May 2020. We published an article about it on 2nd September 2019, drawing attention to the fact that it had been consistently trading well below its net asset value (NAV) for some time. Obviously, when a profitable listed company trades below its NAV, it generally becomes a potential take-over target for both local and international investors.

For the next five years Omnia continued to strengthen and diversify its position. By March this year it was growing profits in all divisions and had a strong balance sheet. This attracted the attention of a large international chemicals company operating out of India, The Solar Group, who have now made an offer to buy 100% of Omnia’s ordinary shares for 13450c each. Omnia will delist from the JSE once the acquisition scheme by Solar SA Investments is implemented.

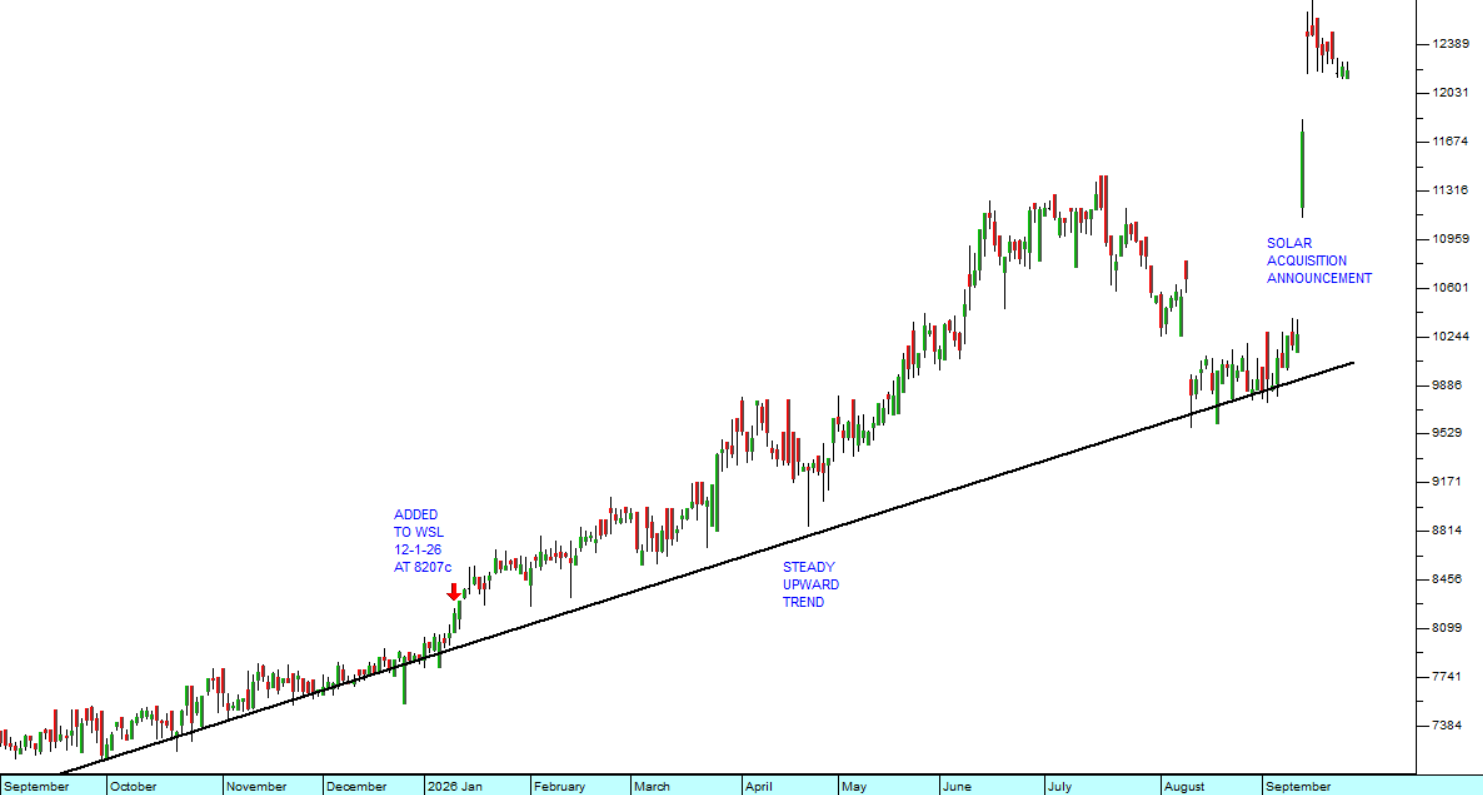
The cautionary announcement was published on the Stock Exchange News Service (SENS) on 11th September this year and the share price immediately rose sharply in response. The fact that it did not rise earlier indicates that there was little or no insider trading associated with this announcement. Consider the chart:

Omnia (OMN) : September 2025 - 25th of September 2026. Chart by ShareFriend Pro.

In anticipation of good results at the year-end in March 2026, we added Omnia to the Winning Shares List (WSL) on 12th January 2026 at a price of 8207c per share. At the time we felt that the company was trading well below its value given its track record and performance.

The Solar Group sells its products in 90 countries around the world and has manufacturing facilities in 11 countries. There are considerable synergies flowing from the acquisition, especially considering that Solar does not appear to be in agricultural sector. Omnia’s expertise and product knowledge will add considerably to the group over time.

Taking into account that an investor would have received 750c in dividends, the decision to buy into Omnia when we added it to the WSL would have yielded a return of 13450c + 750c – 8207c = 5993c or 73% in a period of much less than a year. Altogether a very satisfactory investment!

Using AI  (2026-09-21)

Artificial Intelligence (AI) has been sweeping the world over the past year affecting almost every field of human endeavour. The investment world is no exception. Today the private investor, through AI, has access to a range of analysis which is totally unprecedented and lightning fast. For example…

Artificial Intelligence (AI) has been sweeping the world over the past year affecting almost every field of human endeavour. The investment world is no exception. Today the private investor, through AI, has access to a range of analysis which is totally unprecedented and lightning fast. For example, if you pose the following to Google's Gemini:

“Using a price:earnings growth ratio (PEG), with historical earnings figures over the past 10 years, compare Clicks and Dischem on the JSE for relative value at their current prices”.

A few seconds later, you will receive the following answer:

Based on a 10-year historical valuation framework using the Price/Earnings-to-Growth (PEG) metric, Clicks Group Limited (CLS) offers significantly better relative value than Dis-Chem Pharmacies Limited (DCP), with Clicks holding a PEG ratio of 1,07 compared to Dis-Chem's elevated PEG ratio of 4,92. While both healthcare retailers have faced growth pressures over the past year, Clicks’ consistent long-term earnings growth profile maps to a far more sustainable valuation at current market prices.

It then goes on to say:

To understand the core drivers behind these valuation gaps, we normalize the current trailing Price-to-Earnings (P/E) ratios against their respective multi-year historical Compound Annual Growth Rates (CAGR) in Headline Earnings Per Share (HEPS).

Clicks Group (CLS) — Steady Compounder

  • Robust Growth Track Record: Over the past decade, Clicks Group has compounded its diluted HEPS at an impressive 13,5% per annum, alongside a dividend growth rate of 14,2%.
  • Defensive Cost Efficiencies: Its massive retail presence (~1,000 stores) gives it exceptional operating leverage. At a current P/E of 14,45x, the market has compressed Clicks' historical premium rating (which typically sat closer to 30x), creating a much safer entry point where the earnings growth rate almost directly mirrors its multiple.

Dis-Chem Pharmacies (DCP) — Growth Disruption

  • Earnings Volatility: While Dis-Chem Pharmacies initially listed with immense growth premium expectations in 2016, its long-term financial delivery has slowed down. For instance, its FY2026 annual performance saw a sharp 17,3% drop in HEPS to 113,7 cents due to significant operational and macroeconomic pressures.
  • Depressed Growth Base: Compounding its HEPS from its first full year post-listing (74,7 cents in FY2017) to FY2026 yields a long-term compound growth rate of only 4,78%. A P/E multiple of 23,53x is highly mismatched against this lower single-digit structural growth pace, heavily inflating its PEG ratio.

Risk Guardrails & Framework

Peter Lynch’s traditional benchmark dictates that a PEG ratio near 1,0 indicates a stock is fairly priced relative to its growth, while any metric significantly exceeding 2,0 alerts investors to potential overvaluation relative to realized history. For long-term portfolios, Clicks presents a structurally sound baseline where you are paying a reasonable price for a stable, high-return business framework, whereas Dis-Chem requires aggressive operational margin expansions (such as its automated staffing framework 2.0 initiatives) to justify its present multiple.

This analysis shows that Clicks is cheap at current prices, while Dischem is probably over-priced. Of course, you could have come to the same conclusion if you had done the work yourself, but that would be extremely laborious and time-consuming. For many months now we have been watching Clicks closely. Its price has virtually halved since the middle of last year. And when the price of a blue chip share like Clicks halves, it is always worth investigating.

Of course, before you know to ask such a question you would need to have a basic understanding of how the PEG ratio works or even that there is such a thing as the PEG ratio. Even with the advantage of AI, you need to know enough to be able to ask the right questions – but AI can help you with that too.

We are not suggesting that you let AI make your investment decisions, but we are suggesting that when you find an investment idea it can be a very powerful tool for analysis.

And we do believe that Clicks offers significant value at current levels. Certainly, we believe that it is far better value than Dischem. That is why we asked AI the question in the first place.

JSE Top 40

100,698.00 (-0.85%)

All Share

108,515.00 (-0.82%)

Financial 15

24,842.00 (-0.22%)

J200
J203
J212
Top Gainers
# Code Name Close (c) % move
1 ACS ACSION 1794 +66.88%
2 DIB DIPULA-B 758 +9.22%
3 CNP CANALPLUS 5799 +8.09%
Top Losers
# Code Name Close (c) % move
1 DTC DATATEC 5150 -39.91%
2 GPL GRANPRADE 148 -13.95%
3 CHP CHOPPIES 77 -13.48%

Top Movers – Charts

Top Gainer: ACS
Top Loser: DTC