Market View
J200 99,412.00 -2.42% J203 107,622.00 -2.20% J210 108,167.00 -5.12% J211 120,149.00 -0.06% J212 25,570.00 -1.95% J213 136,166.00 -1.05%
Winning Shares (Top 5)
Code Name Added Price Latest % Gain % Gain/Year
CLH CITYLDG 2025-11-07 436 439 +0.69% +0.70%
VOD VODACOM 2025-02-04 11611 16018 +37.96% +21.89%
MTN MTN-GROUP 2025-01-15 9729 19841 +103.94% +58.10%
BYI BYTES 2026-05-20 8300 10109 +21.80% +48.81%
CLI CLIENTELE 2026-05-05 1880 1971 +4.84% +32.12%
Opinions (Top 5)
Code Name Date Action
OAO OANDO 2026-11-01 View

Oando (OAO) is an oil and gas company located primarily in Nigeria. It has listings on both the JSE and the Nigerian stock exchange. The problem with a share like this from a private investor's perspective is that it is highly risky. Firstly, it is a commodity share whose fortunes are determined by the international price of oil.

Secondly, its business is located in Nigeria which tends to be politically unstable. Oando's shares are also very thinly traded. In its results for the year to 31st December 2025 the company reported revenue of 3,18bn Niara compared with N4bn in the previous year. Headline earnings per share (HEPS) came in at 2c compared with a loss of 3c in the previous period.

In its financials for the 3 months to 31st March 2026 the company reported revenue of N989,5m compared N932,5m in the comparable quarter. HEPS for the quarter was 0c compared with 1c in the comparable quarter. for the 3 months to 30th September 2026 the company reported revenue of N712,6m compared with N820,7m in the previous period.

Headline earnings per share (HEPS) was N1c unchanged from the comparable period. The share seldom trades, with about R3000 worth of shares changing hands each day on average. It is not practical for private investors.

KP2 KORE 2026-11-01 View

Kore (KP2) is a potash mining company which owns 97% of Sintoukola Potash which has the Kola and Dougou (DX) mining leases in the Congo. Kola has a resource of 508m tons and Dougou has a resource of 1,1 billion tons of lower grade material. On 29th January 2019, the company announced the completion of a definitive feasibility study (DFS) done by a consortium of French engineering companies.

The DFS showed an internal rate of return (IRR) of 17% at a price of $350 to $360 per ton generating a free cash flow of about $500m per annum. The average operating cost is under $62 per ton. The targeted production of 2,2m tons per annum gives the mine a 33-year life. In its results for the year to 31st December 2025 the company reported total comprehensive income was $19,926,064 with cash and cash equivalents of $10,555,176 as at 31 December 2025.

The company made a headline loss of 0,02c (US) compared with a loss of 0,03c in the previous period. The company said, "The Directors prepared a cash flow forecast for the period ending 31 March 2027, which indicates that the Group will not have sufficient liquidity to meet its working capital requirements to the end of the going concern period (March 2027)".

In an update on the three months to 31st March 2026 the company said, "As at 31 March 2026, the Company held c.US$8.3 million in cash. There were no mining production or construction activities during the Quarter". In an update on the 3 months to 30th June 2026 the company reported, "Efforts during the Quarter have been largely focussed on advancing the Formal Sale Process" At the end of the period the company had $7,5m in cash.

In an operational review for the 3 months to 30th September 2026 the company reported, "As at 30 September 2026, the Company held c.US$6.4 million in cash. There were no mining production or construction activities during the Quarter". Obviously, this is a risky penny stock because it is mining a commodity in the Congo, and it is not producing yet.

The share has become a speculative win on occasions for investors. We added it to the Winning Shares List (WSL) on 16th May 2024 at 20c and it has since risen as high as 99c (19-9-25) before declining to 80c (30-10-26). It remains speculative. 

NWL NUWORLD 2026-11-01 View

NuWorld (NWL) is an importer and exporter of a range of consumer goods, especially, consumer electronics, appliances, and consumer durables. Its product range includes agencies for Telefunken and JVC as well as a range of vacuum cleaners, fans, large and small appliances, cell phones, heaters, and liquor.

The share has been listed on the JSE since 1987 and has been a consistent producer of profits and dividends over many years. The share is relatively thinly traded and has many days without trade, which makes this share impractical for private investors. In its results for the year to 31st August 2026 the company reported revenue down 1,8% and headline earnings per share (HEPS) up 0,9%.

The company's net asset value (NAV) was 7716c per share. Technically, the share is relatively thinly traded with some days where there are no trades. The share has been falling or moving sideways since March 2022, but does appear to be staging some sort of recovery and trades well below its NAV.

ARL ASTRAL 2026-10-30 View

30-10-2026   Astral Food (ARL) is a leading poultry producer in South Africa. The company's activities include integrated broiler operations, where they have a processing capacity of 4,4 million broilers per week; Ross Poultry Breeders, which supplies breeding stock to the South African broiler industry; National Chicks, which is a day-old chick and hatching egg supplier; and Meadowfeeds, which has seven mills producing a wide range of specialised products for farm animals.

Buying this share is a gamble on weather conditions and the cost of feed (maize). Since poultry imports into South Africa are about 30% of total consumption, it is also a gamble on the dumping of cheap chicken onto the South African market by Europe, Brazil, and the US - but at current levels the share looks reasonable.

As an essential service, Astral has not been greatly impacted by COVID-19 except that it is expecting an over-supply of chicken as a result of higher unemployment in due course. Overall, we view this as a relatively risky commodity share, but one which is trading well below previous levels.

In its results for the six months to 31st March 2026 the company reported revenue up 11,4% and headline earnings per share (HEPS) up 467%. The company said, "The Group operating profit increased significantly off a low base to R1 214 million (March 2025: R271 million), underpinned by improved margins in the Poultry Division off lower poultry feed costs".

In a trading statement for the year to 30th September 2026 the company estimated that HEPS would increase by between 95% and 105%.  Technically, the share was in an upward trend from August 2025, but began correcting from February 2026. The company has had problems with feed costs and has been impacted by the unreliability and costs of electricity and water.

Rising maize and fertiliser costs as a result of the war in Ukraine and the rising price of fuel as a result of the Iran war negatively impacted margins as well as the recent avian flu. We find this company generally well-managed and cheap at current levels - but volatile.

GLN GLENCORE 2026-10-30 View

30-10-2026   Glencore (GLN) describes itself as, "...one of the world’s largest global diversified natural resource companies and a major producer and marketer of more than 90 commodities." The group's operations comprise around 150 mining and metallurgical sites, oil production assets and agricultural facilities. With a strong footprint in both established and emerging regions for natural resources, Glencore's industrial and marketing activities are supported by a global network of more than 90 offices located in over 50 countries.

So, this is a massive, diversified mining house which markets its products all over the world and is involved in almost every mineable commodity that exists. This means that it is far less volatile and risky than other less diverse mining houses. Since the commodity cycle turned at the start of 2016, one of the greatest beneficiaries has been Glencore, particularly because of the fact that it owned the world's richest source of cobalt in the Democratic Republic of Congo (DRC).

Cobalt is the metal used in the batteries which will be needed by the world's shift to electric motor vehicles. The problem is that the government in the DRC is in the process of declaring cobalt to be a "strategic mineral" - which means much higher tax. In its results for the six months to 30th June 2026 the company reported revenue up 49% and earnings per share (EPS) of 37c (US) compared with a loss of 0.05c in the previous period.

The company said, "H1 2026 was characterised by the significant repricing of energy and closely related markets and risks, following escalation of the Middle East (ME) conflict". In an update on the 3rd quarter to 30th September 2026 the company reported copper production up 2%, cobalt down 20%, zinc down 4%, lead down 9%, gold down 6%, silver down 10% and chrome was up 11%.

The company said, "After adjusting for disposals and closures (Mount Isa copper and Kidd), YTD copper production was 12% higher than the comparable 2025 period". We added this share to the Winning Shares List (WSL) on 30th September 2025 at a price of 7983c. It has since moved up to 11895c (29-10-26).

Glencore is confident that Eskom will reduce its electricity by as much as 54% to make it competitive with Chinese imports. Technically, the share has been in an upward trend since April 2025 which we expect to continue, but is dependent on the prices of the commodities which it produces, especially copper.

Glencore announced on 25th September 2026 that it would commence a secondary listing on the Australian Stock Exchange (ASX) on 14th October 2026. 

Winning Share: BYI
Opinion: OAO
Sasol and the Rising Oil Price  (2026-10-26)

Every major event that happens in the world inevitably offers some kind of investment opportunity for the private investor. The challenge is to work out how best to capitalise on it. So, it was with the war in Iran. At the time that the war began with the Israeli and American bombing raids on 28th…

Every major event that happens in the world inevitably offers some kind of investment opportunity for the private investor. The challenge is to work out how best to capitalise on it. So, it was with the war in Iran.

At the time that the war began with the Israeli and American bombing raids on 28th February 2026, we had already been watching the progress of Sasol for some time. The situation in Iran was tense with riots reported and North Sea Brent had climbed back up to $70 per barrel, but we had no idea that the Americans and Israelis were about to launch a bombing attack.

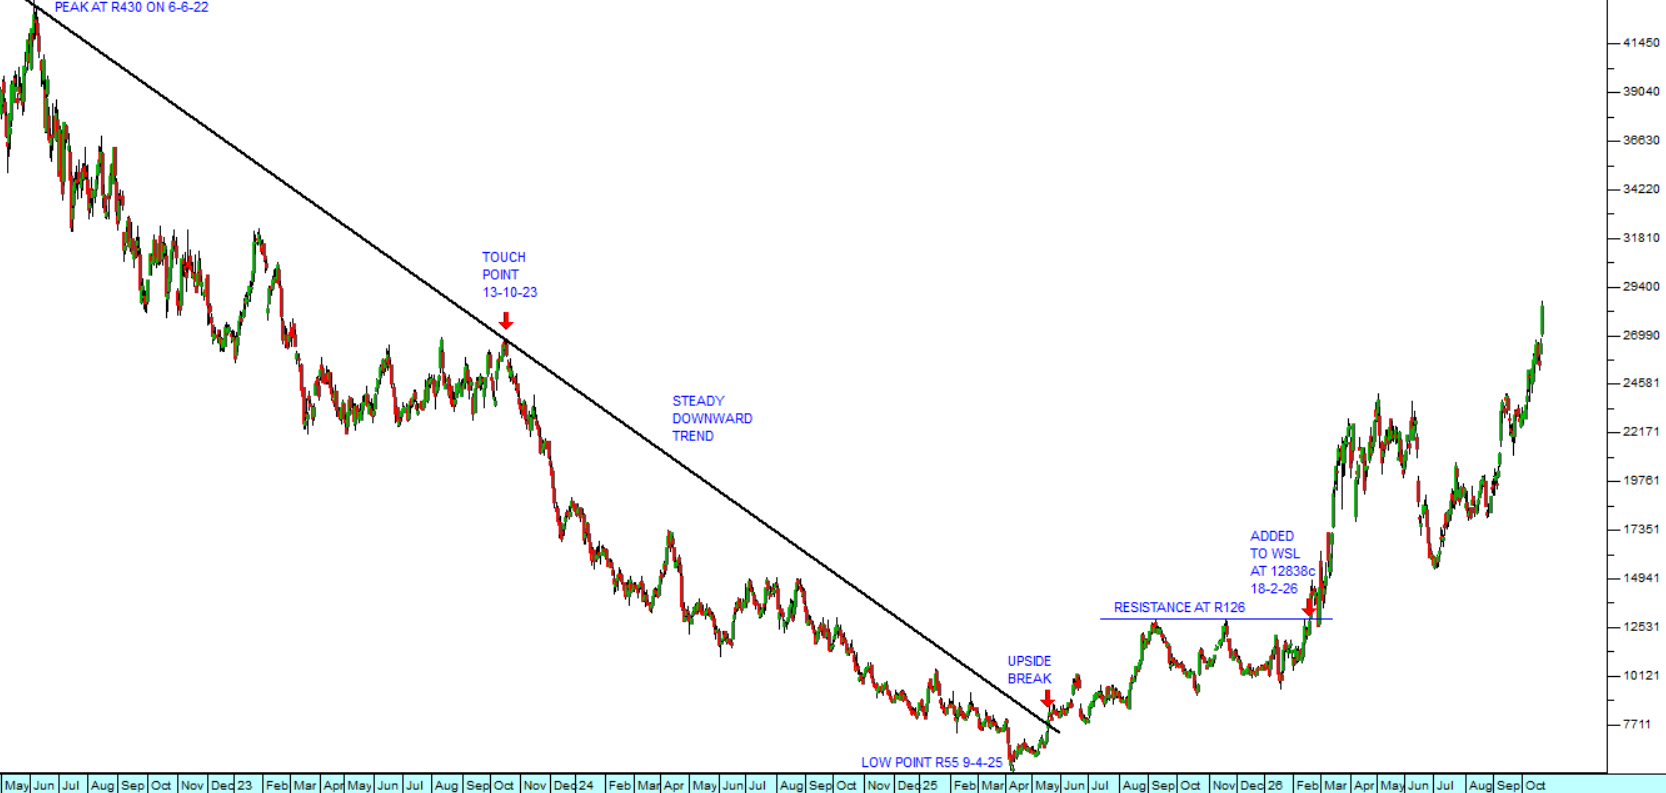
Sasol was always a blue-chip share and has historically occupied a dominant position in South Africa's synthetic fuels industry. It had, however been through some difficult times and the share price had fallen from a high of R430 per share to as low as R55 in April 2025. It then went through an extended period of sideways consolidation. We finally decided to add it to the Winning Shares List (WSL) on 18th February 2026 at a price of R128.36. Technically the share broke above resistance at R126 indicating that something was afoot. Consider the chart:

Sasol (SOL) : May 2022 - 23rd of October 2026. Chart by ShareFriend Pro.

The chart shows Sasol’s long downward trend that began in the middle of 2022, mainly because of the falling price of various grades of oil. North Sea Brent oil fell from a high of $125 per barrel on 8th March 2022 to its cycle low just below $60 per barrel in mid-December 2025. Since Sasol derives more than half of its revenues and profits from the fuel industry, it is directly linked to the price of oil.

Sasol had been recovering but had encountered significant resistance at R126 per share. When it broke decisively above that level, that gave us the signal we needed. Immediately prior to the start of the war the oil price had been climbing, and in January 2026 there were riots in Iran which Trump and Netanyahu used as a pretext to begin the bombing. The price of Brent rose above $70 per barrel on 18th February, before the bombing started, and that triggered a rise in Sasol’s share price. We decided then that Sasol was probably under-valued and due for an upside move.

Sasol’s latest results for the year to 30th June 2026 show the benefits of the rising price of oil. Turnover was up 9% and earnings before interest taxation depreciation and amortisation (EBITDA) was up 17% while the company reduced its debt by 11%.

We do not normally advise investors to buy commodity shares like Sasol because they are riskier, but sometimes they can offer very good capital gains. In the case of Sasol the share appreciated rapidly after we added it to the WSL and then there was a correction as the oil price temporarily fell back in June and July this year. We held on because we thought there might be further upside potential.

The best investment policy is to try to hold onto your shares for at least three years, unless you are moving into a loss position (i.e. you had to execute an early stop-loss sale). This is because if you hold them for less than 3 years the Receiver may seek to declare you to be a share dealer – and then any gain you make will be added to your taxable income and you will be taxed on it at your marginal rate. If you hold for longer than 3 years, then your appreciation is treated as a capital gain for tax purposes and taxed at 18%.

As it turns out holding on to Sasol was the right decision and the share has now appreciated by 134% in about 8 months since we added it to the WSL – which is just shy of 200% per annum.

October Month  (2026-10-19)

There are generally two types of risk in the share market – the risk that a specific share which you have bought falls known as unsystematic risk, and then the risk that the market as a whole falls and drags all your shares down with it - known as systematic risk. The systematic risk that the market…

There are generally two types of risk in the share market – the risk that a specific share which you have bought falls known as unsystematic risk, and then the risk that the market as a whole falls and drags all your shares down with it - known as systematic risk. The systematic risk that the market is in or about to enter a bear trend is obviously a vital consideration for the private investor. During a bear trend about 80% (or more) of shares will fall while only 20% will rise. This means that from a purely statistical point of view it is better for private investors to stay out of the market during bear trends.

It is also very important to be able to distinguish between a correction (which is often a buying opportunity) and a bear trend. The safest approach is always to always buy shares which are rising, in sectors which are rising in a market which is rising. At the same time keeping a strict stop-loss strategy is vital to protect the bulk of your capital. As a private investor you should have an absolute rule that you never lose more than 15% on any share market investment – ever – and that should include your dealing costs. This can only be achieved if you buy free-dealing shares and always adhere to a strict stop-loss strategy.

Today, Monday 19th October 2026 is the exact anniversary of the greatest single day crash in stock market history. Thirty nine years ago, on Monday 19th October 1987, Wall Street collapsed. The S&P500 index fell more than 20% in the day. Other famous bear trends have also begun in October month, including the infamous 1929 crash, the bear trend of the year 2000, the 2008 sub-prime crisis, and the bear trend of 2022 associated with the Ukraine War. So, October month has a bad reputation with investors, and they generally heave a sigh of relief when it is over.

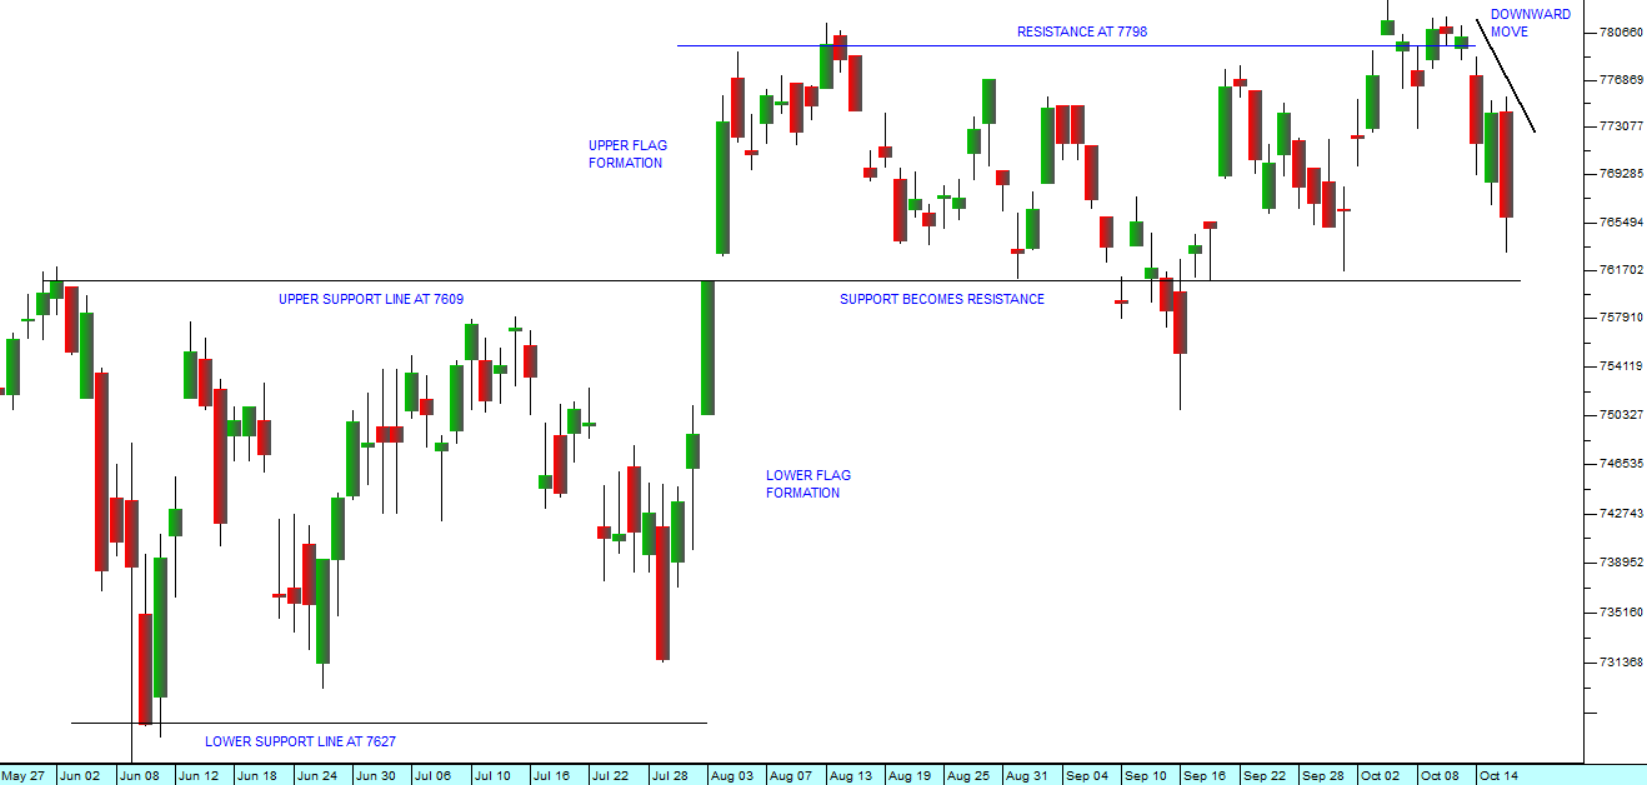
Ominously, Wall Street has been falling over the last week as the Iran war flared up again, pushing the price of North Sea Brent up to nearly $110 per barrel. Consider the chart:

S&P500 Index : 27th of March 2026 - 16th of October 2026. Chart by ShareFriend Pro.

In our analysis, we have drawn your attention to the fact that the S&P500 index has been moving through two sideways markets or flags as the countervailing forces of the rising oil price and the profitability of the artificial intelligence (AI) revolution play out.

The climb in the fuel price is causing a re-evaluation of inflationary risks throughout the world, but especially in America, where the price of petrol has remained stubbornly above $4 per gallon and diesel has hovered above $6 per gallon. With the mid-term elections just weeks away, Republicans and especially Trump are facing a barrage of criticism for their handling of the economy. The Iranians on the other hand are doing everything in their power to keep the oil price at high levels to put the maximum pressure on Trump.

What is notable is that the high oil price appears to be having less and less impact on Wall Street as time goes by. When Trump and Netanyahu began their war with Iran the S&P fell back sharply to 6611 on the 6th of April 2026, and the price of Brent oil went above $110 per barrel. Today Brent is again hovering close to those levels and the S&P has recently managed to reach a new record high at 7818. The world has been facing increased levels of inflation, rising interest rates, and record bond yields - but despite that, AI and corporate profits continue to take the market higher.  

In our opinion, as soon as October month is safely behind us and especially if the mid-term elections have the effect of reducing Trump to a lame dog president, we can look forward to a Christmas rally in the S&P500 during the festive season and into next year. As usual, we strongly advise you to be vigilant and to maintain your stops.

Quantum Computing  (2026-10-12)

We live in an age where advances in technology are driving the gains in productivity and profits, and then being discounted directly into share prices. Artificial intelligence (AI) is already well established and being used by most companies to improve productivity. This can be seen in the results…

We live in an age where advances in technology are driving the gains in productivity and profits, and then being discounted directly into share prices. Artificial intelligence (AI) is already well established and being used by most companies to improve productivity. This can be seen in the results coming out of the companies in the S&P500 index. The impact of AI has only just begun to be discounted and now the next major technological breakthrough, quantum computing, is hovering in the background.

Quantum computing is essentially a jump forward in hardware which allows computers to analyse multiple different solutions simultaneously. Instead of using bits which are either 1 or 0, a quantum computer uses qubits which can exist in multiple states simultaneously - together with quantum entanglement. The technology uses the laws of physics at the atomic and subatomic level to solve complex problems much faster than regular computers, even supercomputers. Microsoft, Google, Amazon, Oracle, and even Meta and Tesla, are rushing to install quantum computing into their infrastructure. In a word, quantum computing will increase the power of AI substantially making it even faster and more powerful than it already is.

With that background, the earnings of S&P companies for the third quarter are beginning to trickle in, with 19 companies having reported so far. Total 3rd quarter earnings for those companies that have reported results already are up +150.9% from the same period last year on the back of revenues which are +27% higher. 79% of those companies are beating EPS estimates and 73.7% are beating revenue estimates.

The average estimate for all S&P500 companies is that earnings will be up by 24,3% in the 3rd quarter when compared with a year ago – and this will be the 8th straight quarter where estimates have been in positive double digits. 15 out of 16 sectors are expected to make significant gains – led by the technology and energy sectors.

As things stand now, the progress of the S&P500 index is being significantly held back by developments in Trump’s Middle East war and the price of oil. Iran would like to hold the price of North Sea Brent above $100 per barrel, at least until after the mid-term elections on 3rd November 2026 – which of course is very bad news for the struggling Republican party and Trump.

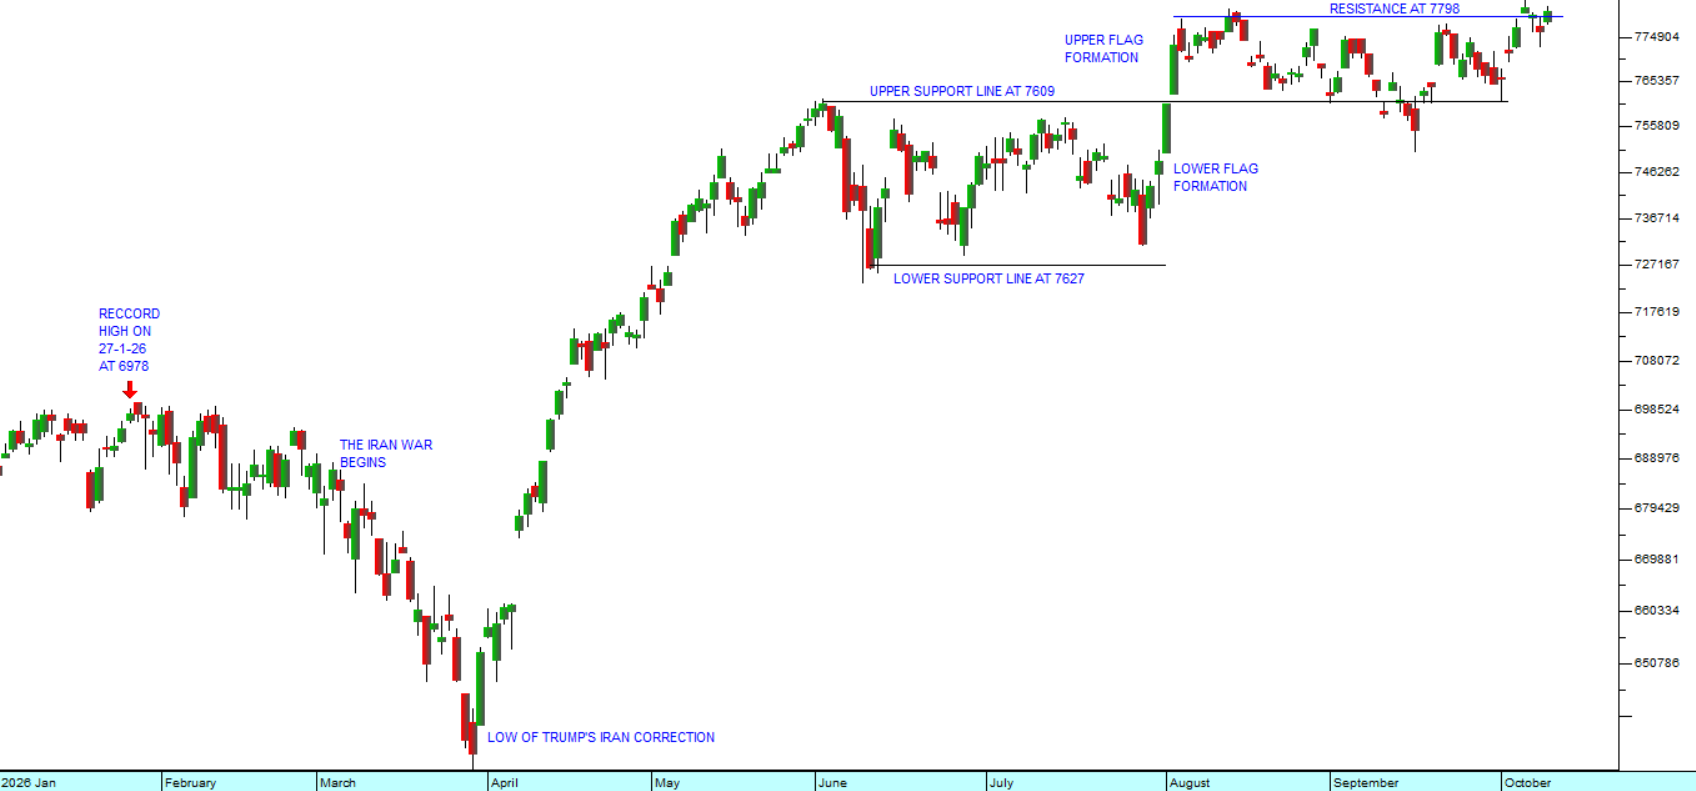
Looking at the chart, the S&P500 index has been moving through a series of protracted sideways markets for the past four months. During that time, technology and the prospects of that technology have not stood still. They have been advancing at a rapid pace.

Our belief is that as soon as the situation in the Middle East is resolved and the oil price comes back to where it was before the war began, the S&P will suddenly begin discounting the impact of the accumulated technical advances and move sharply higher. It will be like removing the lid from a pressure cooker. Consider the chart:

S&P500 Index : January 2026 - 9th of October 2026. Chart by ShareFriend Pro.

So, what we are saying is that considerable bullish potential has been built up by this war and its impact on oil prices. This can be seen from the fact that even with Brent at over $100 a barrel now, the S&P is still making new record highs, based on the exceptional estimates of 3rd quarter earnings and beyond.

There are, of course, those who believe that Brent is about to go much higher – like to $125 per barrel - given the escalation in Yemen with the Houthis and the attacks on the Saudi pipeline. But in our view the underlying direction of the oil price must be downwards as the world moves away from fossil fuels and towards renewables, especially solar.

To be safe, ensure that you have a strict stop-loss level for all the shares in your portfolio. That is the ultimate protection against unexpected downtrends and bear markets. Your absolute rule should be to never lose more than 15% on any share market investment ever – including your dealing costs. Sometimes it is difficult to achieve this, but provided you always choose shares which are free-dealing, it simply becomes a matter of self-discipline. And then if you are able to make several hundred percent on your winners, mathematically, you must be successful over time.


JSE Top 40

99,412.00 (-2.42%)

All Share

107,622.00 (-2.20%)

Financial 15

25,570.00 (-1.95%)

J200
J203
J212
Top Gainers
# Code Name Close (c) % move
1 EMH E-MEDIA 225 +14.80%
2 SEP SEPHAKU 198 +13.14%
3 NVS NOVUS 580 +7.21%
Top Losers
# Code Name Close (c) % move
1 EPS EASTPLATS 230 -30.93%
2 ACS ACSION 900 -16.28%
3 HUG HUGE 155 -15.30%

Top Movers – Charts

Top Gainer: EMH
Top Loser: EPS