Market View
J200 100,772.00 +0.16% J203 108,980.00 +0.04% J210 102,724.00 +2.41% J211 128,779.00 -1.71% J212 25,888.00 -0.01% J213 142,161.00 -0.91%
Winning Shares (Top 5)
Code Name Added Price Latest % Gain % Gain/Year
ABG ABSAGROUP 2025-10-11 19460 22040 +13.26% +17.10%
SAC SA-CORP 2023-11-16 211 363 +72.04% +26.89%
BWN BALWIN 2025-08-26 269 425 +57.99% +64.34%
BYI BYTES 2026-05-20 8300 9169 +10.47% +61.64%
IMP IMPLATS 2025-06-10 15021 17742 +18.11% +16.29%
Opinions (Top 5)
Code Name Date Action
RNI REINET 2026-07-22 View

Reinet (RNI) is an investment holding company whose main asset for many years was a stake in British American Tobacco (BAT). In its financial results for the year to 31st March 2026 the company reported a net asset value (NAV) of 36,31 euros, down from the previous year's figure of 38,04 euros.

The  company said, "Ordinary and special dividends received from Pension Insurance Corporation Group Limited during the year amounted to EUR 303 million - Reinet sold 100 per cent of its holding in Pension Insurance Corporation Group Limited to Athora Holding Ltd for proceeds of some EUR 3.3 billion". At 30th June 2026 the company had an NAV of 38,87 euros per share and 171,3m shares in issue.  The share, which acts as a rand-hedge due to its euro-denominated assets, fell from a high of R343 in February 2020 to a low of R246 in March 2020 as a result of COVID19.

A technical breakout above its long-term downward trendline occurred on 16 September 2019 at R270. On 27th May 2026 the share fell heavily on its latest results but remains in a long-term upward trend. Investors should consider the rand’s prospects when evaluating this stock, but we believe it represents good value at current levels.

SOL SASOL 2026-07-22 View

Sasol (SOL) is a massive international chemicals and energy company which has its roots in the oil-from-coal technology developed during the apartheid era in South Africa. About 50% of the company's profits are directly linked to the oil price. It has two main growth areas - its 50% stake in an ethane cracker plant in Louisiana, America, known as "Lake Charles Chemical Project" (LCCP), and its development of gas resources in Mozambique.

Sasol was awarded two new licences in Mozambique to explore for gas in an onshore development of approximately three thousand square kilometres. This could significantly add to its existing gas projects in the Rovuma province. One area of concern for Sasol is that it is the biggest producer of greenhouse gases in South Africa and on the JSE.

It is listed as one of the 100 fossil-fuel companies world-wide that contribute to more than 70% of Greenhouse gases. The company remains under international pressure to deal with its carbon emissions effectively. After the impact of COVID-19, the share made a dramatic recovery which was been brought to an end by the decline in commodity prices, especially oil.  The company is planning to close some international operations to reduce costs.

On 25th May 2025 the company announced a settlement in its dispute with Transnet in terms of which Transnet will pay it R4,3bn. In its results for the six months to 31st December 2025 the company reported turnover unchanged with a 3% increase in sales volumes. Headline earnings per share (HEPS) fell 34% and net debt increased substantially to $63,3bn.

The company said, "The Group generated positive free cash flow in the first half of the financial year for the first time in four years, despite the challenging macro environment. This was supported by the higher sales volumes, lower cash fixed costs and lower capital expenditure".

In an update on the nine months to 31st March 2026 the company reported, "Despite the Middle East conflict constraining sour crude supply, Sasol mitigated this through sourcing sour crude from other regions, resulting in continued strong sales volumes for the quarter". In an update on the year to 30th June 2026 the company said, "Supported by stronger production performance and a more supportive macroeconomic backdrop during the last quarter of the financial year, the business delivered within or above our market guidance across all our production and sales metrics". Technically, the share has recently (on 25th May 2025) broken up through its long-term downward trendline on 20th May 2025 at a price of 7950c and has now moved up to 18925c.

It is in a volatile new upward trend which was interrupted on Friday 16th January 2026 when Morgan Stanley downgraded the company to "underweight" according to the Business Day (19/1/26). It is benefiting from the rise in the fuel price and was added to the Winning Shares List (WSL) on 18th February 2026 at a price of 12838c.

It has subsequently moved up to 23894c - on 5th May 2026, but has fallen back since then. When the oil price is high Sasol benefits, but as soon as it begins to fall again the share price comes off.

KIO KUMBA-IO 2026-07-22 View

Kumba (KIO) is a highly successful iron mining operation which is owned (79%) and controlled by Anglo American. The share price fell to as little as R223 in March 2020 because of COVID-19 but recovered to R668 before falling on the March 2022 quarterly results. Importantly, exports make up 94% of the company's total sales - which means that it is not heavily dependent on local sales but is vulnerable to any strengthening of the rand and the effectiveness of rail transport to ports.

The company is planning to build a 100mw solar park over the next 3 years to reduce its reliance on Eskom. The company has had to contend with heavy rain and bad rail performance. On 10th October 2022, Kumba announced that, because of the force majeure at Transnet, it would lose about 50 000 tons of production per day, rising to 90 000 tons after 7 days as a direct result of the Transnet force majeure.

Furthermore, they said they would lose about 120 000 tons of exports which will cost them about $8,5m a day in production and $11,7m in lost export revenue. The company is considering 490 retrenchments. In its results for the year to 31st December 2025 the company reported revenue up 2% and headline earnings per share (HEPS) up 18%.

The company said, "Average realised free-on-board (FOB) export price of US$95 per wet metric tonne, 12% above benchmark. Cost savings of R673 million. R5.1 billion saved since 2024. Resilient adjusted EBITDA* margin of 46%, up from 41%. Closing net cash* of R14.9 billion". In a production update for the 3 months to 31st March 2026 the company reported total [production down 2% and total sales up 3%.

The company said, "Kumba achieved an average realised free on board (FOB) export iron ore price of US$93 per wet metric tonne (wmt) (Q1 2025: US$98/wmt)". In a trading statement for the six months to 30th June 2026 the company estimated that HEPS would fall by between 39% and 43%.

Production was down 3% and sales were down 1%. As at the 21st of July 2026, the share was trading at a multiple of 5,55 and a dividend yield (DY) of 10,05%. This compensates the investor to some extent for the commodity risk in this rand-hedge share, but it remains volatile and hence risky.

Technically, the share has been in a downward trend since July 2021. 

S32 SOUTH32 2026-07-21 View

South 32 (S32) was spun out of BHP Billiton in 2015 and contained all of BHP's South African coal assets. It is, in its own right, a diversified miner of base metals and minerals such as zinc, coal, aluminium, silver, lead, nickel and manganese. It operates in South Africa, South America and Australia.

The company has separated out its coal assets in South Africa and especially those which supply Eskom, into a separate entity which was sold on 1st June 2020 to Seriti. At the same time the company has announced that it has bought the remaining 83% of Arizona Mining which it did not already own.

Arizona Mining has extensive interests in zinc, manganese and silver described by South 32's CEO, Graham Kerr, as "...one of the most exciting base metal projects in the world." Clearly, this is another international mining house that is distancing itself from South Africa because of the administrative and legislative uncertainty here. Kerr has stated that "...mining exploration is out of the question in South Africa until the new mining charter is finalised." In moving away from South African investments, South 32 is following in the footsteps of BHP and Anglo.

In our view, South32 is an excellent mining conglomerate with good medium-term potential to exploit the recovery in base metals and minerals. The company has said that for the moment it plans to hold onto its South Deep mine. The company is continuing with its $1,4bn share buy-back.

The company is working to supply its Hillside smelter with renewable energy and transition away from Eskom over the next 10 years. In its results for the six months to 31st December 2025 the company reported revenue down 3% and headline earnings per share (HEPS) of 9c (US) compared with 8,5c in the previous period.

The company said, "We delivered Underlying EBITDA of US$1.1B and 16 per cent growth in Underlying earnings to US$435M". In a report on the first quarter of 2026 the company reported alumina production up 1% and "Net cash2 increased by US$121M to US$96M in the March 2026 quarter, as we benefitted from continued strength in aluminium and base metals markets".

In an update on the second quarter the company reported sales volumes up 15% and the CEO said, "Our portfolio will be built around high-margin, long-life assets in favourable jurisdictions, with approximately 85% of pro-forma earnings from base and precious metals and approximately 55% production growth from approved projects". Technically, the share has been in an upward trend since September 2025.

We expect this trend to continue, but it remains a volatile commodity share. On 12th May 2025 the company announced that Matthew Daley would join the company as deputy CEO with effect from 2nd February 2026 to succeed Graham Kerr when he retires later in 2026.

NY1 NINETY-1L 2026-07-20 View

Ninety-One is an asset management company spun out of Investec and separately listed on Monday 16th March 2020. The listing occurred just as the corona epidemic was causing world stock markets to crash so the shares fell more than 40% below their pre-listing range on the first day.

There was no initial public offer (IPO). In our view this massive blue chip share is significantly under-valued at current levels. The company's employees now own 22,5% of its equity.  Obviously, this company's performance was impacted by the decline in equities since the pandemic - but the value of its assets under management (AUM) was rising as markets around the world recovered.

In its results for the year to 31st March 2026 the company reported assets under management (AUM) up by 31% to GBP171,8bn and headline earnings per share (HEPS) up 2%. The company said, "The demand recovery for emerging markets is visible and our offering competitive. We are in a stronger position than a year ago".

This share is directly impacted by the direction of the trend on Wall Street and world markets. Technically, the share entered a downward trend in February 2026 and may now represent a buying opportunity on a P:E of 11,37 (17/7/2026). The company confirmed its assets under management at the 30th of June 2026 at GBP184 billion compared to GBP171.8 billion on the 31st of March 2026.

Over the past year the Sanlam UK active asset management business has been taken over by Ninety One adding GBP18,3bn to its AUM. 

Winning Share: IMP
Opinion: KIO
The Hyprop Investment  (2026-07-20)

Property shares do not generally make very exciting investments – but they make up for that by being very secure. Their security lies in the fact that their net asset value (NAV) is mostly comprised of very conservatively valued properties. Other companies often have insubstantial assets in their…

Property shares do not generally make very exciting investments – but they make up for that by being very secure. Their security lies in the fact that their net asset value (NAV) is mostly comprised of very conservatively valued properties. Other companies often have insubstantial assets in their NAV like goodwill, intellectual property and other intangibles.

The property market is recovering from the impact of COVID-19 which saw many good quality property companies trading at a fraction of their NAV. The big institutional investors who make up 90% of the JSE really like secure investments. They were shaken out of property shares by COVID-19, but they are gradually regaining their appetite for them. 

One of the best examples of an institutional share that lost favour in 2020 is Hyprop which reached a low point of 1467c on 24th April 2020 – less than 20% of its NAV at the time. By anyone’s measure at that price it was a raging bargain.

Back then we were not yet producing the Winning Shares List (WSL) but we wrote an article about Hyprop which we published on 23rd November 2020 after the share completed a double bottom or island formation and it began to appreciate. Consider the chart:

Hyprop Investments Ltd (HYP) : March 2016 - 17th of July 2026. Chart by ShareFriend Pro.

The double bottom formation is a very solid and visible indication that a long downward trend is almost certainly over. At the time we recognised that Hyprop had broken up out of its island and was beginning to appreciate.

It took another two years before the institutional investors finally recognised its value and began buying it up in earnest. It began to recover and then we added it to the WSL on 15th August 2024 at 3439c. Since then, it has been appreciating steadily.

You will note that at its peak, back in August 2016, Hyprop reached a record high of 14100c – at which time it was trading almost 50% above its NAV of the time. On Friday last week it closed at 6052c – which was just below its NAV of 6443c. So, we see it as having some considerable further upside potential given the gradual improvement in the South African economy.

When thinking about this company you cannot help being impressed by the high quality of the assets which it owns. These include Canal Walk in the Western Cape, Somerset Mall, Hyde Park Corner, Rosebank Mall, and Clearwater Mall. These assets are almost always close to fully let (3,1% vacancies on average) and patronised by high-end A/B income group shoppers. At year-end on 31st December 2025 the company had a loan-to-value of just 31% - which means that it has plenty of headroom for further acquisitions.

In a pre-close operational update for the five months to 31st May 2026 the company reported a 4,5% improvement in collections and a 5,5% improvement in tenants’ turnover. The company said, “Demand for space remains exceptionally high, with a 0% vacancy rate in May 2026.”

We have no hesitation in recommending this share for your investigation, especially if you are looking for a more conservative long-term investment with a low risk profile.

Altron - 2026 Results  (2026-07-13)

Altron is one of the best companies listed on the JSE and a long-time favourite of ours. We first added it to the Winning Shares List (WSL) back in November 2023 when the share was just 949c. Just over 2 years later in January 2025 it reached a high point of 2439c (10-1-25). After that it moved…

Altron is one of the best companies listed on the JSE and a long-time favourite of ours. We first added it to the Winning Shares List (WSL) back in November 2023 when the share was just 949c. Just over 2 years later in January 2025 it reached a high point of 2439c (10-1-25). After that it moved sideways for the next sixteen months and we only again became interested in it following its trading statement published on 12th February 2026 where it predicted that the headline earnings per share (HEPS) from on-going operations would increase by at least 30%.

After an investigation we decided to again add it to the WSL on 15th April 2026 at a price of 2199c. That was just 3 months ago, and the share has since gone up by an impressive 30% - which equates to about 125% per annum. Consider the chart:

Altron (AEL) : July 2023 - 10th of July 2026. Chart by ShareFriend Pro.

This story is an object lesson in paying attention to the messages which listed companies regularly post on the Stock Exchange News Service (SENS) especially their trading statements. In a trading statement the board of directors give their best assessment of what the company’s HEPS will be in its next set of financial statements.

In Altron’s case their first trading statement was published more than 3 months before its financials came out on 25th May 2026. This gives the active private investor plenty of time to investigate thoroughly and even to visit the companies place of work and try to speak to one of its directors.

When the results finally came out, the share price shot up because they were truly exceptional in a number of respects. Firstly, HEPS from continuing operations rose by a solid 34% and secondly the company showed that they were completely debt-free and had more than R1bn in cash in the bank. As soon as the institutional fund managers saw those points and various other strong ratios in the company’s financials they immediately began buying up as many shares as they could lay their hands on. The result is that the share rose to a new record high of 3005 on 15th June 2026. Since then, it has been moving sideways.

My point is that everything that I have said in this article was in the public domain and you could easily have taken advantage of it. Hopefully, some of you did. The JSE regularly provides excellent highly profitable investment opportunities for those private investors who are willing to a little homework. Your Share Friend software gives you a complete up-to-date list of all the SENS messages published by every listed company every day. All you need to do in Share Friend is hold down the Alt key and press the letter “S”.

Follow-up

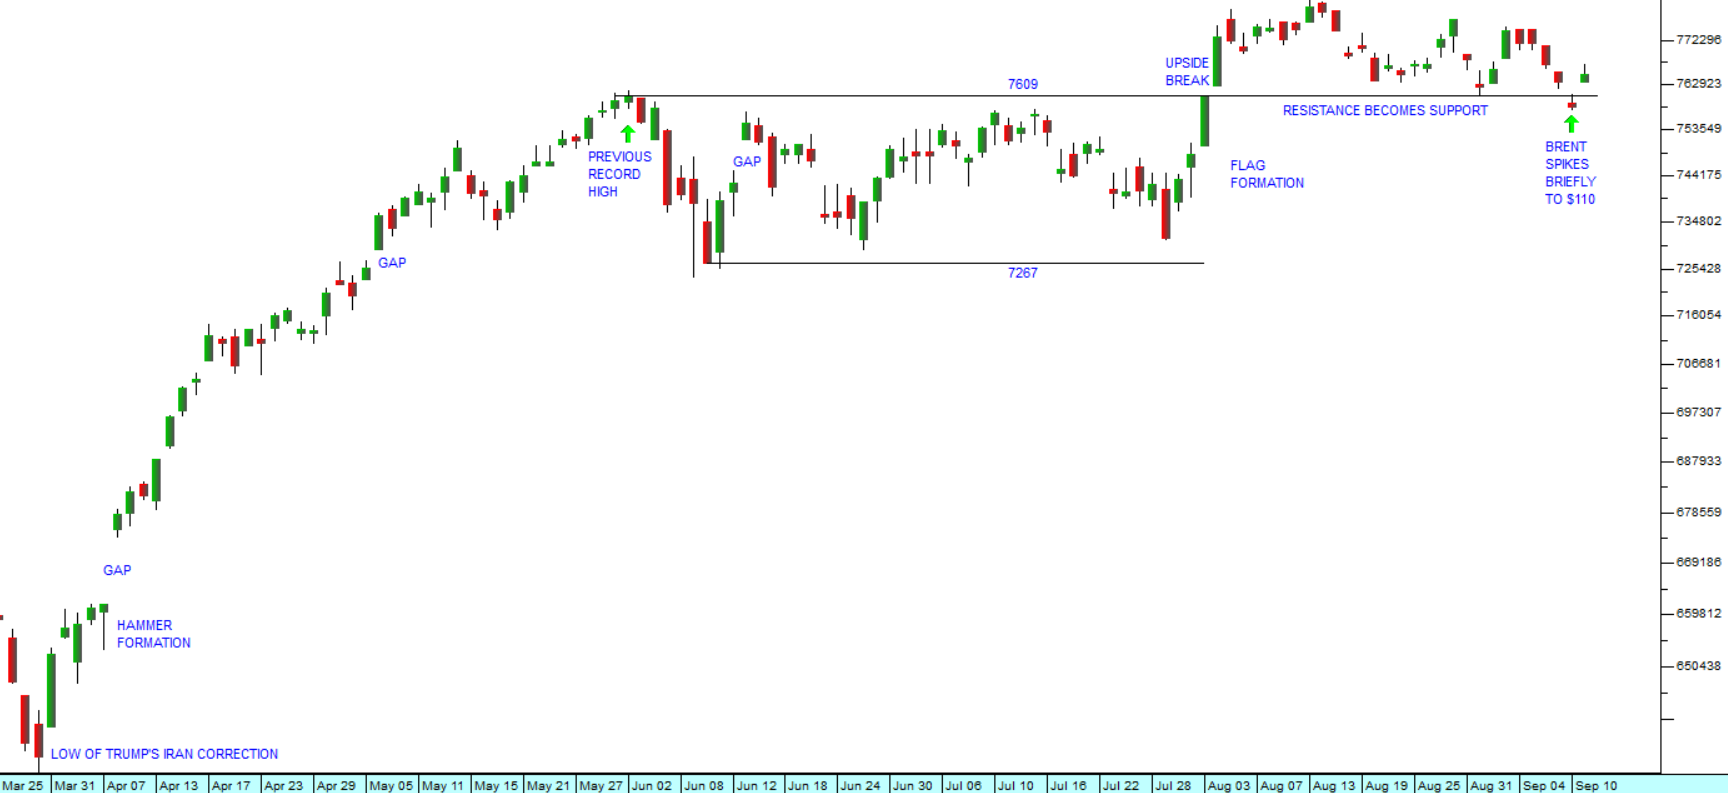
In last week’s article on candlestick charting as it is applied to the S&P500 index, I drew attention to the fact that the S&P was in a triangle formation and I suggested that it would almost certainly break out of that formation to the upside fairly soon. Well, it has now done that. Look at the chart:

S&P500 Index : 2nd June 2026 - 10th of July 2026. Chart by ShareFriend Pro.


In our view it will almost certainly now break to a new all-time record high very soon.

The most notable observation of the week was just how little the oil price went up when Trump decided to resume his bombing of Iran and the Strait of Hormuz was once again closed. Clearly the world economy and the stock market have moved on and the Strait can no longer influence the oil price or the world economy as it did in February.  

Japanese Candlesticks  (2026-07-06)

Long before the Western World had even understood that the study of charts might be beneficial, the Japanese were constructing and studying rice futures charts in a system which today we call candlestick charting. Before candlesticks charts, everyone was using bar charts but today you hardly ever…

Long before the Western World had even understood that the study of charts might be beneficial, the Japanese were constructing and studying rice futures charts in a system which today we call candlestick charting. Before candlesticks charts, everyone was using bar charts but today you hardly ever see a bar chart.

What most investors do not know is that there are literally hundreds of candlestick formations each of which have been extensively analysed and have their own particular interpretations. If you are interested in this, you should get hold of a copy of Japanese Candlestick Charting Techniques: A Contemporary Guide to the Ancient Investment Techniques of the Far East, (1991). The author of the book is Steve Nison.

In candlestick charting, each day’s trade is regarded as a battle between the bulls and the bears which is visible in the opening, highest, lowest and closing prices. So, the body of the candle connects the opening and closing prices. A red body shows that the share closed below the open and a green candle shows that the close was above the open. The shadows (i.e. the lines above and below the body) connect the highest and lowest prices that the share reached during the day’s trade.

Candlestick charting features many different types of candles which can help you to see which way the market is moving.

One of the less common ones is a doji star. This is a candle with a very thin body – in other words where the opening and closing prices are very close – but very long upper and lower shadows – which shows that during the trading day, sentiment swung heavily from being very positive to being very negative – but ended up almost unchanged on the day. Consider the example of a doji star below:

Doji Star formation.

Doji stars usually occur at the top or bottom of a trend and are indication that the direction of the trend is about to change.  

Since the S&P500 reached its all-time high on 2nd June 2026 (at 7609.78), it has been in a triangle formation. Triangles are usually associated with periods of uncertainty, where the level of uncertainty diminishes until the market decides the future direction of the trend by breaking the upper or lower trend lines decisively. The chart below begins with the low point of Trump’s Iran war correction on the 30th of March 2026.   

S&P500 Index : 25th of March 2026 - 30th of June 2026. Chart by ShareFriend Pro.

Shortly after it started going up, the index had a clear hammer formation followed by a gap. The hammer is a very bullish formation which shows that in the battle between the bulls and bears on that day, the bears tried hard to pull the index down, but ultimately could not succeed and it ended slightly up on the day, with the bulls in the ascendancy. The gap which followed that on the next day shows the extent of the bullish sentiment. Then there was a smaller gap in May before the record high was reached.

You will notice that the index has been oscillating since then but that each oscillation has been smaller than the previous one, giving rise to a triangle formation. Last Thursday there was a clear doji star formation. We expect that the index will break up out of the triangle in the next few days.

JSE Top 40

100,772.00 (+0.16%)

All Share

108,980.00 (+0.04%)

Financial 15

25,888.00 (-0.01%)

J200
J203
J212
Top Gainers
# Code Name Close (c) % move
1 CHP CHOPPIES 143 +13.49%
2 WEZ WESIZWE 50 +11.11%
3 FTH FRONTIERT 650 +8.33%
Top Losers
# Code Name Close (c) % move
1 RHB RHBOPHELO 131 -20.61%
2 PMV PRIMESERV 250 -14.97%
3 ISA ISA 200 -14.53%

Top Movers – Charts

Top Gainer: CHP
Top Loser: RHB