Excessive Bullishness

26 February 2024 By PDSNET

On Friday last week, the S&P500 index posted yet another new record closing high, but this time just one point higher than the previous day at 5088. This means that the index, which measures the progress of the 500 largest companies on Wall Street, has been climbing without a significant correction for nearly four months. Consider the chart:
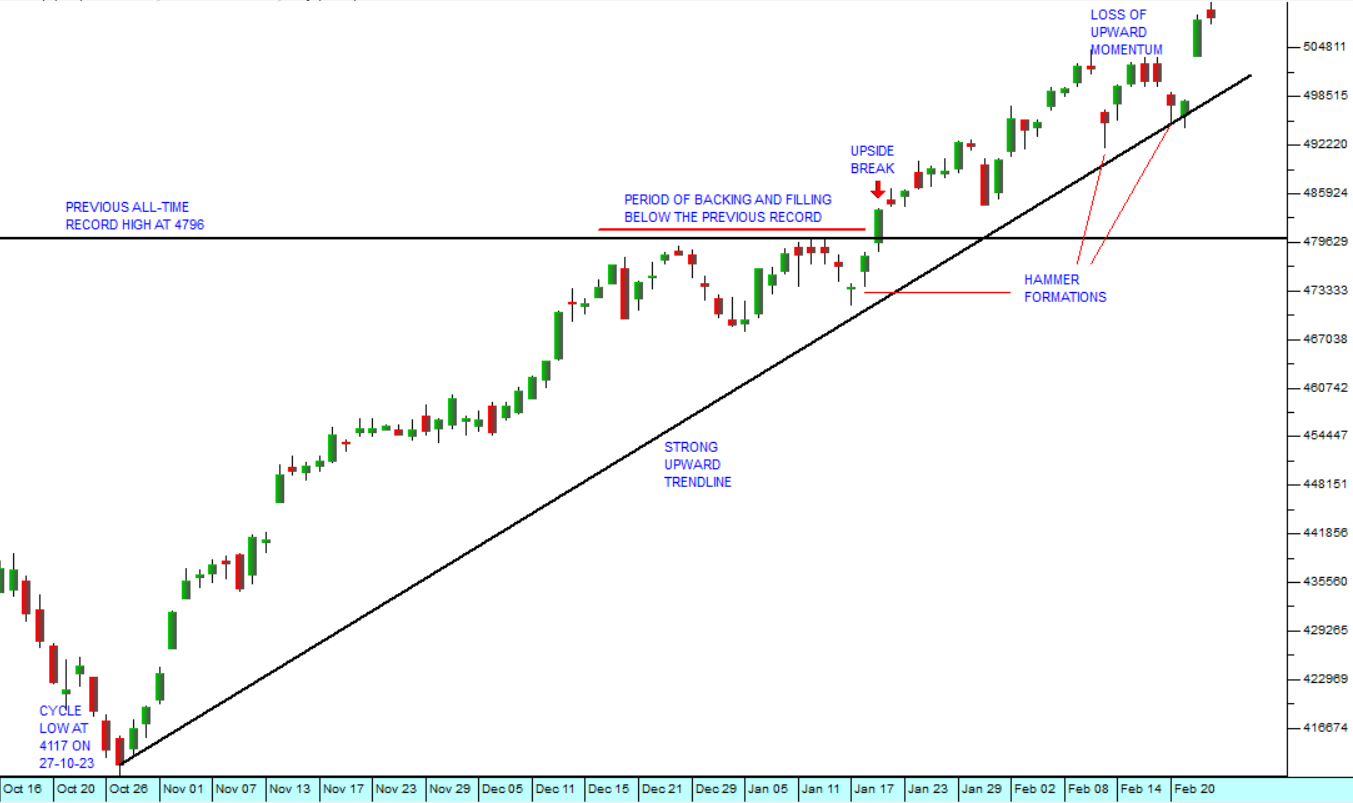
S&P500 Index: 16 October 2023 - 23 February 2024. Chart by ShareFriend Pro.

The chart shows the previous cycle low at 4117 which happened on the 27th of October 2023. Then in late December of 2023 and early January of 2024 there was a period of “backing and filling,” just below the previous cycle high at 4796. The upside break came on the 19th of January when the index broke decisively up through that resistance to a new all-time record high.

The resistant effect of any long-standing previous cycle high, like this one, is shown by the initial difficulty which the index experienced in breaking above it. This is very typical. Any previous all-time record high, which has been standing for a long time, can be expected to arrest upward momentum and sometimes even to stop it completely (resulting in a “double top”). This type of resistance can also be seen at large round numbers – as in this case the index level of 5000 which proved to be a temporary psychological barrier. Once that barrier was convincingly penetrated there was a surge of buying exuberance which took the market up even further.

However, nothing in the market moves in a straight line. And this market is definitely long overdue for a significant correction. The regular appearance of corrections is probably one of the most reliable and consistent maxims of technical analysis. When there has not been a correction for an extended period of time, as is the case now, then it is a clear indication of excessive bullishness in the underlying market.

Investors have literally become over-excited by the strong upward momentum together with the penetration of major barriers like the 5000 level and the 4796 level. To the bulls, the upward momentum is beginning to be seen as a “new normal”.

Of course, it is always difficult to predict exactly when a correction will occur, and this market could certainly go higher - but experienced technicians become increasingly nervous when faced with such a long period of upward movement. The smart money begins taking profits and making it difficult for the bulls to take the market even higher. This causes a loss of upward momentum, which often presages a downward trend.

On the fundamental front, the S&P500 has been buoyed by the good results coming out of hi-tech companies, most notably Nvidia’s recent results for the 4th quarter of 2023. The company posted revenue of $22,1bn – which was 22% above the 3rd quarter and up 265% from a year ago. Nvidia produces a chip which is specifically designed for artificial intelligence (AI) systems. The CEO, Jensen Huang, said, “Accelerated computing and generative AI have hit the tipping point. Demand is surging worldwide across companies, industries and nations.” 

The current situation is similar in many ways to that which occurred in the 1920’s when the widespread use of telephones, mass-produced motor vehicles and the spread of railways had an enormous nation-wide impact on productivity leading to a stock market boom. AI is a development which is potentially impacting the productivity and profitability of almost all companies.

But we say again, nothing in the markets moves in a straight line. Some sort of correction is inevitable, sooner or later.


DISCLAIMER

All information and data contained within the PDSnet Articles is for informational purposes only. PDSnet makes no representations as to the accuracy, completeness, suitability, or validity, of any information, and shall not be liable for any errors, omissions, or any losses, injuries, or damages arising from its display or use. Information in the PDSnet Articles are based on the author’s opinion and experience and should not be considered professional financial investment advice. The ideas and strategies should never be used without first assessing your own personal and financial situation, or without consulting a financial professional. Thoughts and opinions will also change from time to time as more information is accumulated. PDSnet reserves the right to delete any comment or opinion for any reason.


Share this article:

PDSNET ARTICLES

Bitcoin's Collapse

We have said previously that cryptocurrencies like Bitcoin cannot be assessed using fundamental analysis – because they have no fundamentals. They have no balance sheet or income statement, and they generate no income for investors. For this reason, they can only be assessed technically - by looking at the charts.

Speculative Opportunity

PDSnet is mainly concerned with teaching private investors about investment and medium to long-term opportunities on the JSE. The foundation of this approach is that South African tax law treats any gain on a share held for longer than 3 years as a capital gain. In other words, holding a share for more than 3 years means that the investor will not be treated as

Scary Government Debt

Just like a household or an individual, a country’s government goes into debt because it spends more than it receives in taxes and other revenue. The important difference, of course, is that governments (unlike households or individuals) can actually create money out of nothing to finance their deficit if they choose to. This is known as quantitative easing (Q/E).

Correction

On the 10th of July 2024, we tweeted (on “X”) that “...some sort of correction is looking more and more likely.” Four trading days later on the 16th of July 2024, The S&P500 index reached its highest point (5667.2) and began that correction. So far, the S&P has fallen 8,5%. Consider the chart:

WeBuyCars - Follow-up

WeBuyCars (WBC) was spun out of Transaction Capital (TCP) and separately listed on the JSE on 11th April 2024 – just over three months ago. Before the listing we published an article on the 8th of April 2024, in which we suggested that the share would be a solid blue-chip

Bell Equipment

We are often asked what prompts us to add a share to the Winning Shares List. The answer is that it is a variety of factors – but usually because the share appears to be very cheap in relation to its fundamentals. In other words, we expect it to be upwardly re-rated as its fundamental value becomes recognised by the institutional fund managers. A

JSE All Time Record High

On Friday last week, the 12th of July 2024, the JSE Overall index closed at 81686 – an all-time record high. Consider the chart:

The chart shows that the Overall

Construction

The entire construction industry was decimated by the 2008 sub-prime crisis, the ANC under Jaco Zuma’s presidency and then finally by the pandemic in 2020. Hundreds of thousands of jobs were lost and massive companies like M&R were reduced to penny stocks on the JSE.

The JSE Construction and Materials Index (JS5011)

Murray & Roberts

A company’s debt is critical in establishing the risk inherent when investing in its shares. High debt levels expose the company to high interest and capital payments and can swallow up a large part of whatever profits it makes. Low debt levels give the company the headroom to invest in further growth either organically

Mr Price

Mr Price is a well-known and focused retailer of clothing in South Africa. It is a quintessentially South African company, and its performance is a direct reflection of the state of the economy and the level of consumer spending. It is an extremely well-managed company in a very tough and competitive market. Clothing is sold by many dedicated outlets in South Africa and almost