Cartrack Vs Mix Telematics

22 April 2020 By PDSNET

Two of the most interesting companies listed on the JSE are Cartrack (CTK) and Mix Telematics (MIX). Both companies are involved in providing remote fleet and asset management systems. Both companies started in South Africa recovering stolen vehicles and both have spread across the world expanding their client base and broadening their product options.

As listed shares, both companies have the distinct advantage that the majority of their income takes the form of annuity income. They also service companies with almost no working capital - which means that their income is fairly secure, even in these difficult times. They also both offer a rand-hedge element.

A comparative relative strength chart of Cartrack against Mix Telematics shows the following:
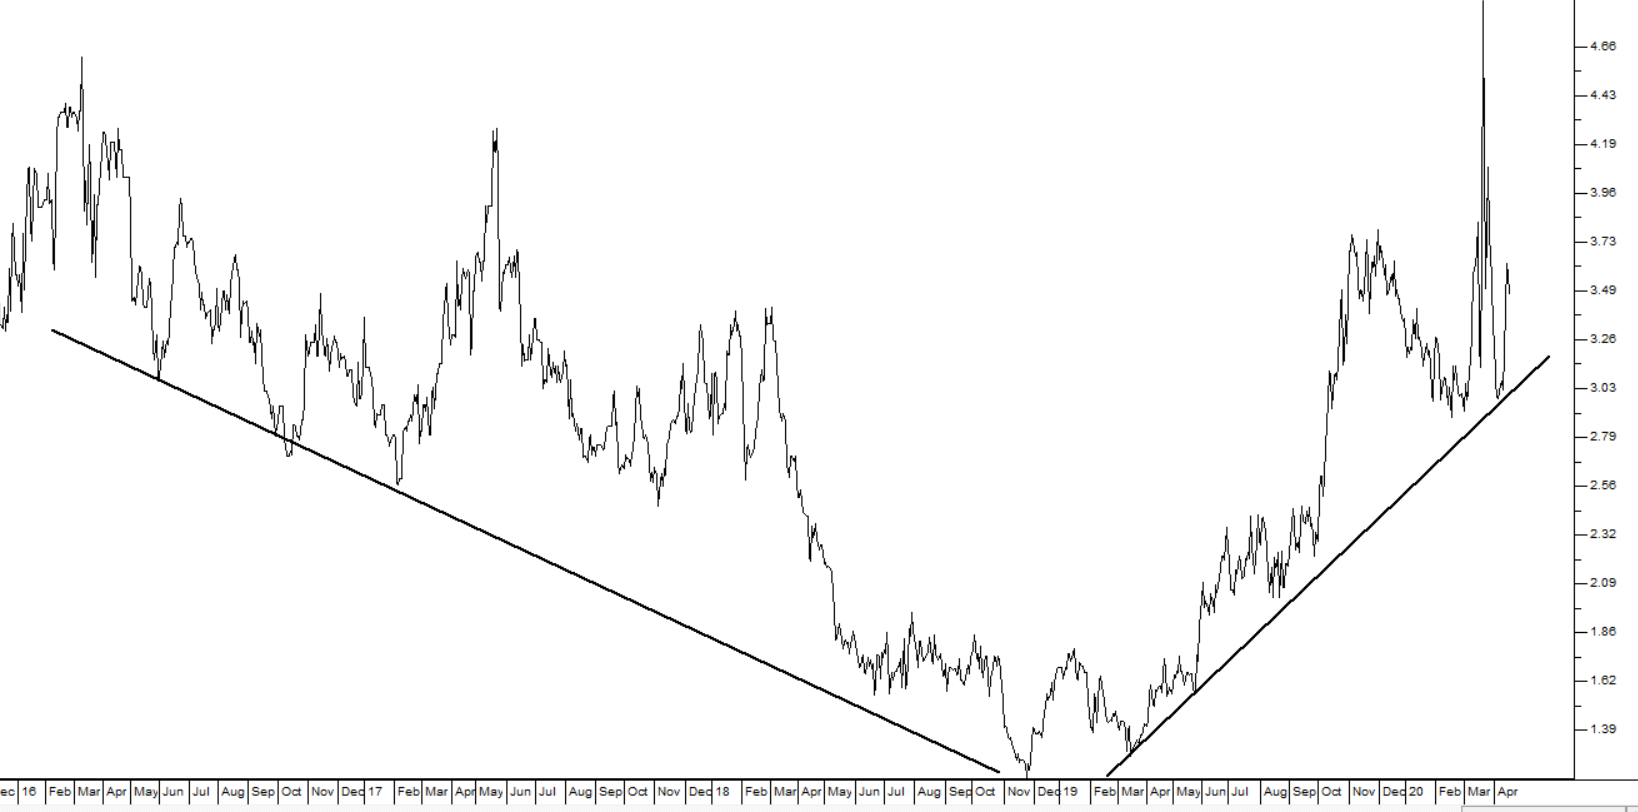
Comparative Relative Strength Cartrack (CTK) and Mix Telematics (MIX) January 2016 to April 2020 - Chart by ShareFriend Pro

As you can see here, in 2016 to 2018, Mix Telematics was out-performing Cartrack consistently, but since then Cartrack has been doing better.

This is also reflected in the two companies' P:E ratios. Mix Telematics is on a price:earnings ratio (P:E) of 15,98 while Cartrack is on a P:E of over 60.

As a private investor this situation should raise some questions. Why do investors favour Cartrack so much more than Mix Telematics? Is there an opportunity here?

Mix Telematics claims 817000 subscribers with 87% of its income in subscriptions (i.e. annuity income) and an EBITDA margin of 30%.

Cartrack claims 1039000 subscribers with 96% of its income in subscriptions and an EBITDA margin of 51%.

Cartrack trades an average of 24% more in rands per day than Mix Telematics - which perhaps shows that Cartrack is more favoured by institutional investors. Both companies have more than enough liquidity in their shares for private investors.

On paper, Cartrack is out-performing Mix Telematics by a healthy margin although both companies are growing rapidly.

Perhaps the best method of seeing which company offers the best value right now is to look at their price:earnings growth ratios (PEG).
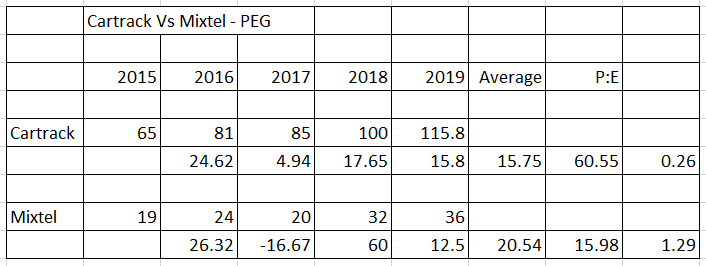
Table Comparing the PEG ratio of Cartrack and Mix Telematics from 2015 to 2019

The table above shows the percentage in earnings per share (EPS) of the two companies going back to 2015 and then uses that to calculate their respective PEG ratios.

Surprisingly, Cartrack's average growth in earnings over that 5-year period (15,75%) is noticeably less than Mix Telematics's (20,54%) - a fact which is clearly not reflected in their share prices.

This leaves Cartrack with a PEG of 0,26 while Mixtel has a PEG of 1,29 (if you are not sure about PEG ratios, go to Module 10: P:E and EPS as a Measure of Share Value).

This shows that Mix Telematics offers far more value that Cartrack at current prices and Cartrack looks distinctly over-priced.

Of course, that does not necessarily mean that Mix Telematics shares will do better in the future - but it is certainly a starting point for investigation.  


DISCLAIMER

All information and data contained within the PDSnet Articles is for informational purposes only. PDSnet makes no representations as to the accuracy, completeness, suitability, or validity, of any information, and shall not be liable for any errors, omissions, or any losses, injuries, or damages arising from its display or use. Information in the PDSnet Articles are based on the author’s opinion and experience and should not be considered professional financial investment advice. The ideas and strategies should never be used without first assessing your own personal and financial situation, or without consulting a financial professional. Thoughts and opinions will also change from time to time as more information is accumulated. PDSnet reserves the right to delete any comment or opinion for any reason.


Share this article:

PDSNET ARTICLES

WeBuyCars - Results

The financial results of companies show how profitable they are and give a good indication of their share’s risk and potential return. WeBuyCars (WBC) is a recent listing which came to the JSE on the 11th of April 2024. Unlike other listed motor vehicle companies, it is a company which specialises in the purchase and sale

Choosing Winners

We are often asked how we go about selecting the shares to put on to the Winning Shares List (WSL). Right now, there are 102 shares on the list with 5 having gone down since they were added, 94 are up and 3 are unchanged. On an annualised basis, 24 of them are performing at above 100% per annum.   

As a private investor,

Kore Revisited

Kore (KP2) remains at once the most exciting and most risky investment on our Winning Shares List (WSL) at the moment. We originally added it to the list just over a year ago on 16th May 2024 at a price of 20c. It subsequently rose to a high of 83c on 3rd October 2024 and we published an article

Rand Strength 2025

The strength of the rand is both a critical and a complex issue for private investors on the JSE. Our currency is influenced by two primary forces:

  1. Our local economy’s prospects
  2. The rand’s role as a leading emerging market currency

These, in turn, are

Sibanye Revisited

In these uncertain times, when nobody really knows to what extent Trump will back down on the international trade war which he has initiated, many investors are moving into precious metals as a hedge against the weakness of paper currencies (especially the US dollar) and paper assets like equities and bonds.

The problem

Smart Local Investors

The last two months have been wild on the markets – mainly because of Trump’s ill-advised, on-again, off-again tariff policies. The issue now is:

Will this morph into a full-blown bear trend? Or is this correction almost over?

From his election victory on the 6th of November 2024,

Jerome Powell

The Federal Reserve Bank (“the Fed”) is completely outside the control of the President and Executive Branch of the US government. The chairman of the Fed is appointed for a renewable 4-year term by the President. The President cannot remove the Chair without cause. The current chairman, Jerome Powell was appointed by Trump during his first term as President and reappointed by

Uncertainty Soars

Investors are by their very nature risk takers, but they are always trying to reduce the risk which they have to take to a minimum. Donald Trump, with his threat of an international trade war and his on-again, off-again tariffs has significantly increased the level of risk in markets across the world. This can be seen in the extraordinary volatility in the S&P500

Liberation Day

Trump has done the unthinkable. He has deliberately engineered the collapse of the US and world stock markets in the nonsensical belief that somehow an international trade war will make Americans richer. Nothing could be further from the truth. His actions have taken the S&P down from its all-time record high of 6144.15 on 19th February 2025 to Friday’s

The Creation of Money

The money supply of a country is a symbol of the goods and services of that country. Obviously, if the size of the money supply is increased more rapidly than the real growth of its economy, then you have more money chasing the same goods and services, resulting in rising prices. Since, over the long term, the only organisation that can create money is the government,