Capitec
20 December 2021 By PDSNETCapitec has been, arguably, one of the best investments on the JSE over the past 20 years. It was launched by PSG and listed on the stock exchange in February 2002. Since then, it has become a disruptive powerhouse in the banking industry, consistently taking market share away from the four big banks in South Africa. By market capitalisation it is now more than double the size of Nedbank, 83% larger than ABSA, 6.3% bigger than Standard Bank and 69% of the size of FNB. And it is still growing rapidly. Consider the chart:
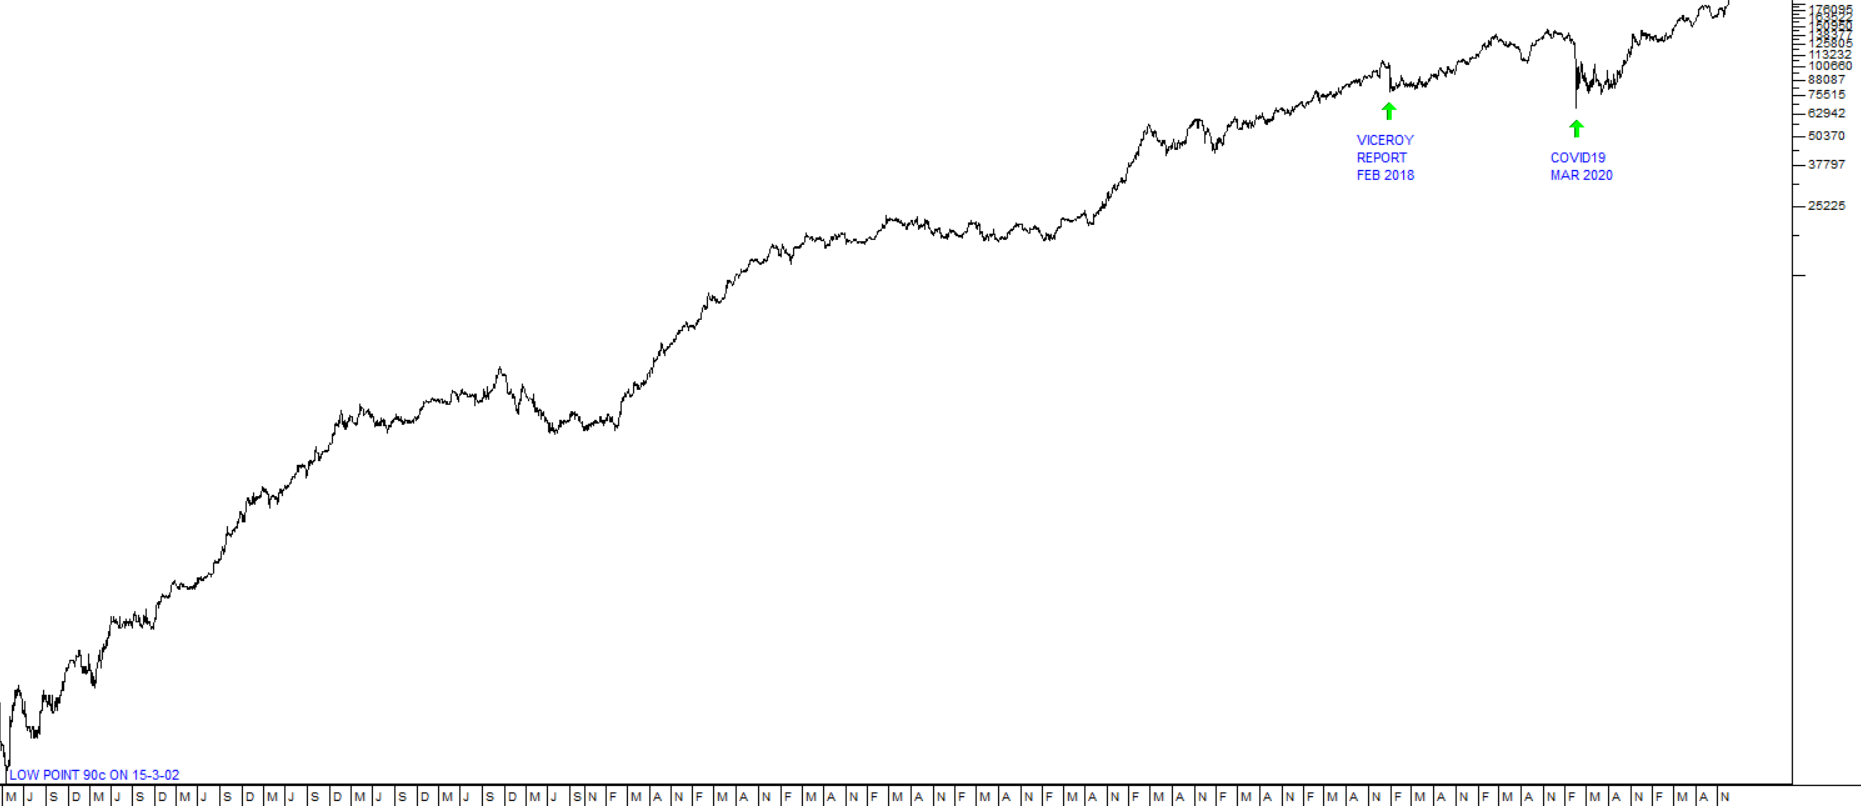
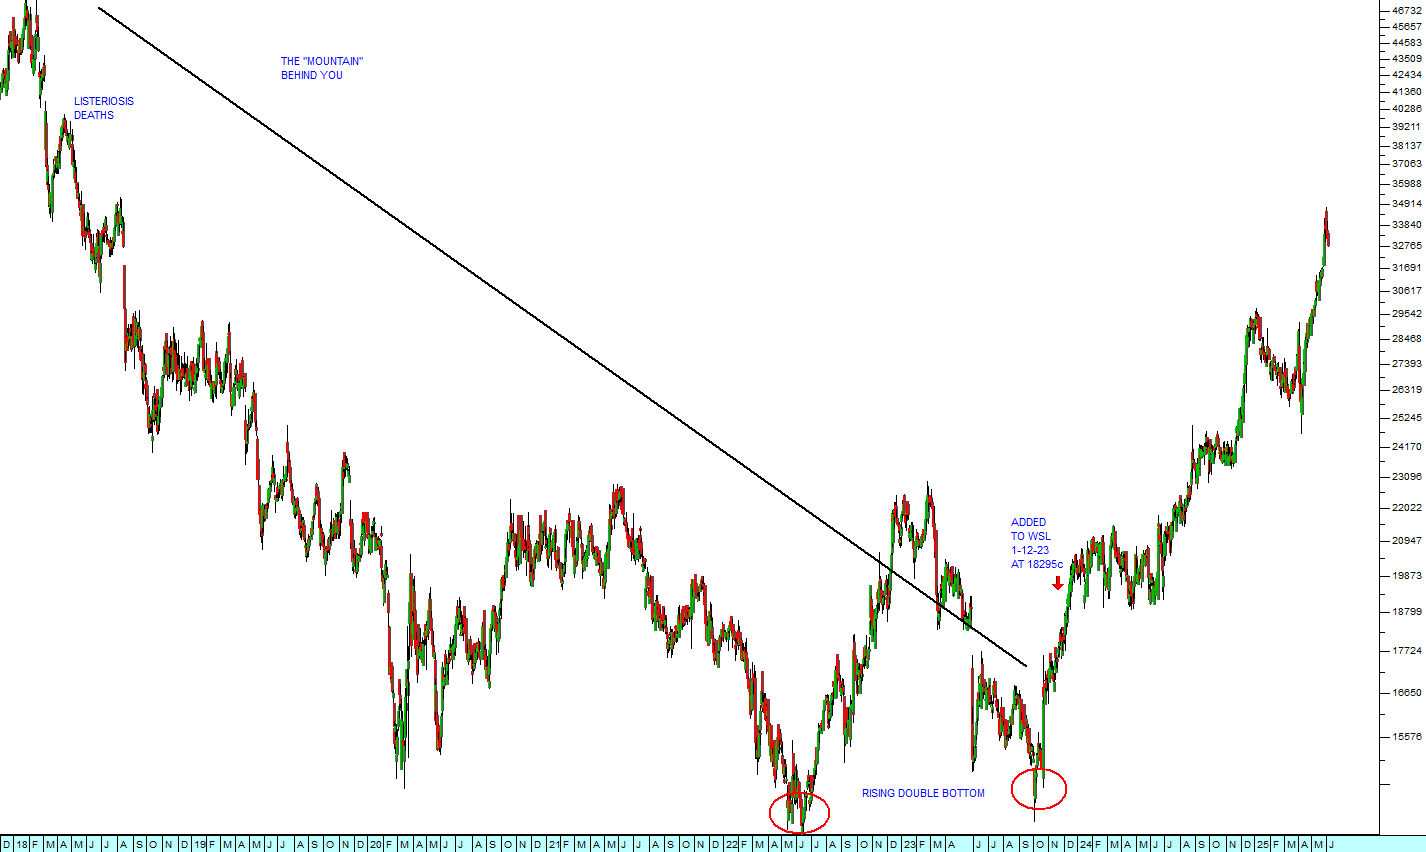
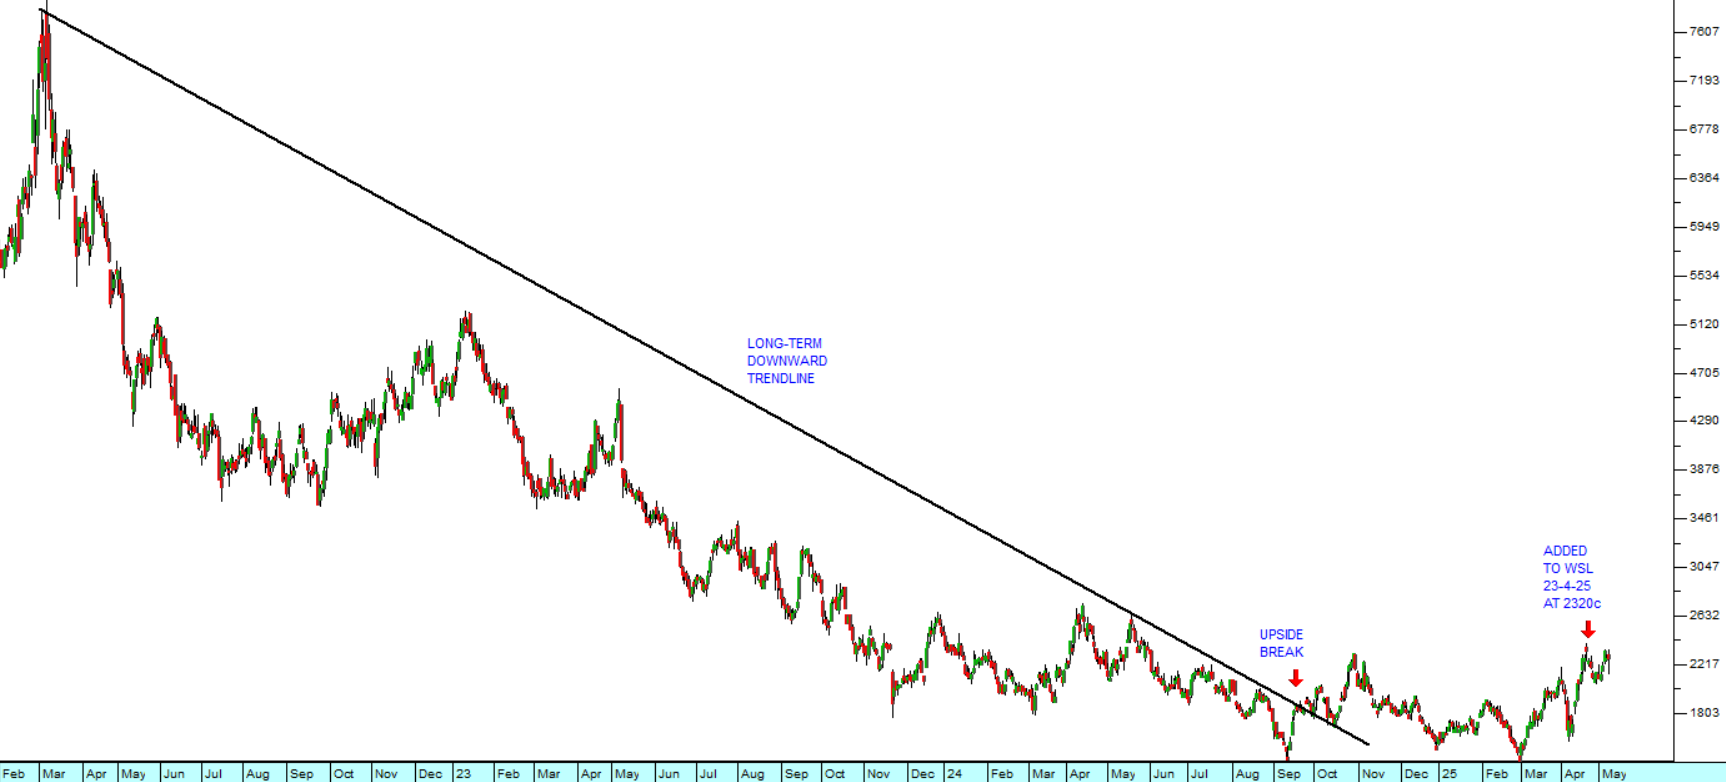
This chart is a semi-logarithmic chart showing the closing price of Capitec from its listing in February 2002. You will immediately see that the chart is what we call a “diagonal” because it goes from the bottom left-hand corner of your screen to the top right-hand corner. On 15th March 2002 you could have bought the share for just 90c. On Friday last week it touched an intraday record high of just over R2000 per share.
We have been urging you to invest in Capitec shares since February 2018 just after the Viceroy Report came out when it was about R820 per share. We drew your attention to the fact that its price:earnings growth ratio (PEG) which was then 0,63 clearly showed that it was cheap. Read the article here.
The PEG ratio compares a company’s earnings track record with its current price earnings ratio (PE) to determine whether it represents good value at the current price. It achieves this by dividing the company’s P:E ratio by the average percentage growth in headline earnings over a long period of time. In the following diagram we compare the percentage growth in headline earnings per share (HEPS) from Capitec with that of FNB over the past 18 years:
| CAPITEC | % | FNB | % | ||
| Year | HEPS | Growth | HEPS | Growth | |
| 2003 | 46 | 92.5 | |||
| 2004 | 70 | 52.17 | 111 | 20.00 | |
| 2005 | 101 | 44.29 | 129.2 | 16.40 | |
| 2006 | 165 | 63.37 | 157.8 | 22.14 | |
| 2007 | 222 | 34.55 | 210.2 | 33.21 | |
| 2008 | 259 | 16.67 | 191.5 | -8.90 | |
| 2009 | 366 | 41.31 | 133.3 | -30.39 | |
| 2010 | 527 | 43.99 | 180.1 | 35.11 | |
| 2011 | 757 | 43.64 | 183.1 | 1.67 | |
| 2012 | 1125 | 48.61 | 231.5 | 26.43 | |
| 2013 | 1519 | 35.02 | 279.6 | 20.78 | |
| 2014 | 1752 | 15.34 | 340.4 | 21.75 | |
| 2015 | 2209 | 26.08 | 381.4 | 12.04 | |
| 2016 | 2787 | 26.17 | 399.2 | 4.67 | |
| 2017 | 3281 | 17.73 | 423.7 | 6.14 | |
| 2018 | 3858 | 17.59 | 472.7 | 11.56 | |
| 2019 | 4577 | 18.64 | 497.2 | 5.18 | |
| 2020 | 5428 | 18.59 | 308.9 | -37.87 | |
| 2021 | 3966 | -26.93 | 480.5 | 55.55 | |
| Average | 29.82 | 11.97 | |||
| P:E | 29.18 | 12.41 | |||
| PEG = | 0.97844 | 1.036764 |
This diagram shows that Capitec’s average growth in earnings over the 18 years back to 2003 has been 29,82% while FNB has managed only 11,97%. So, even though Capitec is trading on a much higher P:E (29,18) compared with FNB (12,41) it has a lower PEG ratio – which means that it remains better value, even at this high P:E.
On Wednesday last week (15th December 2021), Capitec published a trading statement in which it estimated that its HEPS will increase to at least 6940c in the year to end-February 2022. If we incorporate this number into our analysis, then Capitec’s average growth in HEPS over the 19 years is 32,2% and it is trading on a PEG of 0.9062 – making it even better value at the current price of 199940c.
DISCLAIMER
All information and data contained within the PDSnet Articles is for informational purposes only. PDSnet makes no representations as to the accuracy, completeness, suitability, or validity, of any information, and shall not be liable for any errors, omissions, or any losses, injuries, or damages arising from its display or use. Information in the PDSnet Articles are based on the author’s opinion and experience and should not be considered professional financial investment advice. The ideas and strategies should never be used without first assessing your own personal and financial situation, or without consulting a financial professional. Thoughts and opinions will also change from time to time as more information is accumulated. PDSnet reserves the right to delete any comment or opinion for any reason.
Share this article: