Bitcoin's Collapse

9 September 2024 By PDSNET

We have said previously that cryptocurrencies like Bitcoin cannot be assessed using fundamental analysis – because they have no fundamentals. They have no balance sheet or income statement, and they generate no income for investors. For this reason, they can only be assessed technically - by looking at the charts.

In the absence of fundamental value, the price of Bitcoin is a direct and exclusive function of the collective belief of a segment of the investment population which has bought into the cryptocurrency idea. This idea is periodically disturbed by stories about corrupt cryptocurrency dealers, government’s that arbitrarily make laws about cryptos or Elon Musk blowing hot or cold.

Descending triple tops are quite rare in the charting world. For example, the share prices of both Steinhoff and EOH at different times made clear descending triple top formations before they began their respective collapses: Consider the chart of Enterprise Outsourcing Holdings (EOH) during 2015 and 2016:

Enterprise Outsourcing Holdings (EOH): June 2013 - May 2018. Chart by ShareFriend Pro.

You can clearly see the three tops, each lower than the previous one, followed by a massive collapse. Steinhoff is no longer listed, but it also made a descending triple top at around R90 a share before collapsing to less than R5.

Three-and-a-half months ago on 24th May 2024 we posted a tweet in which we said that Bitcoin, “...has completed a "descending triple top" which is probably the most bearish formation. We expect it to fall heavily from current levels.

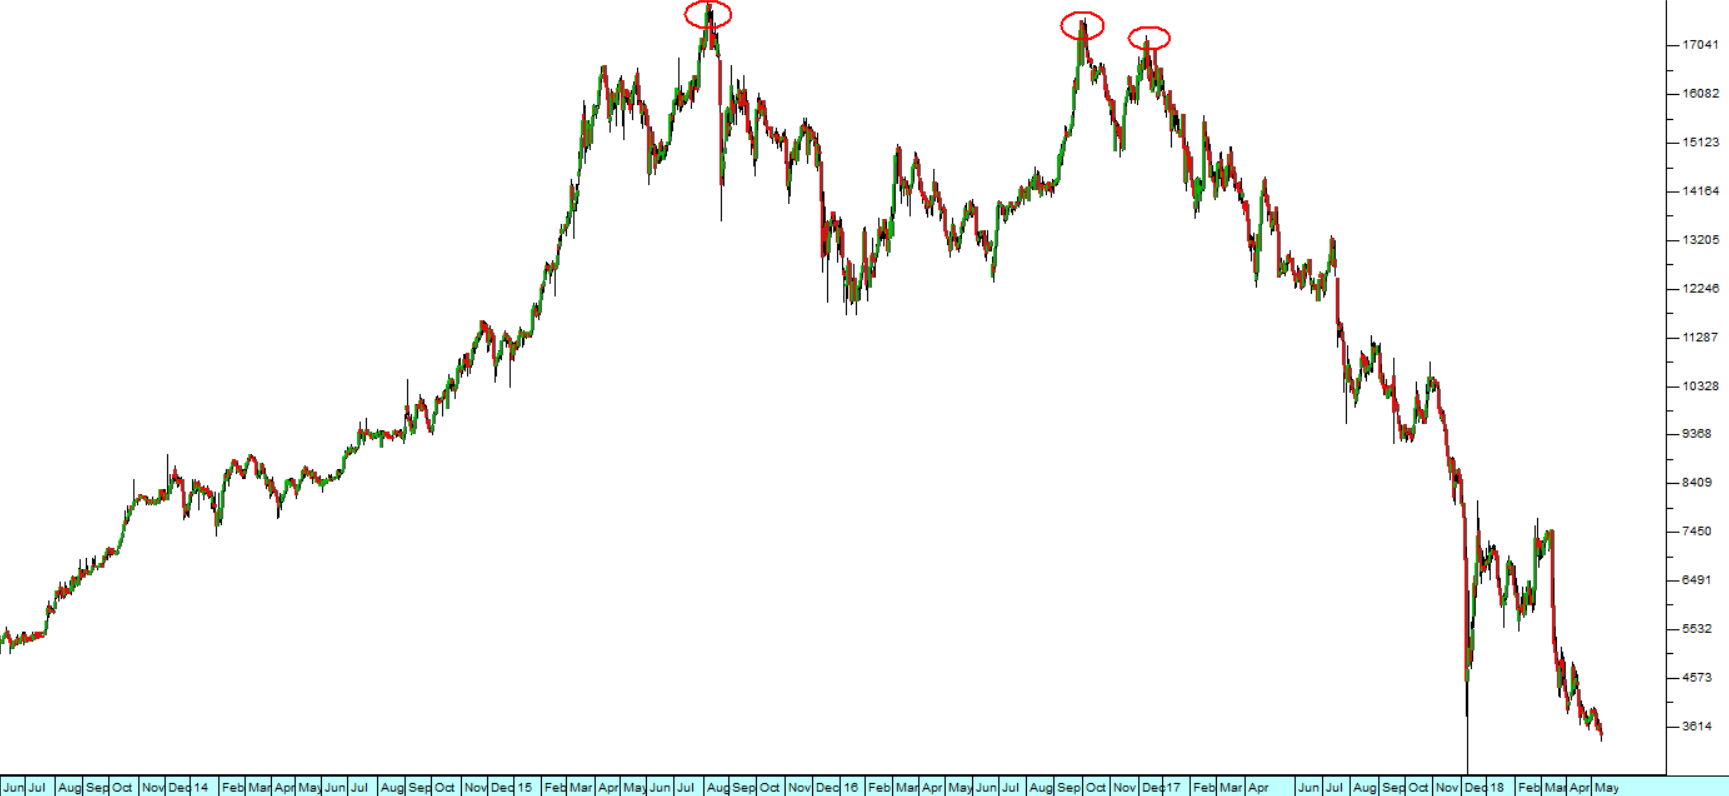
Consider what has happened since then:

Bitcoin: 29 February 2024 - 6th of September 2024. Chart by ShareFriend Pro.

Here you can see the three tops which prompted that tweet – and the two further descending tops which have occurred since then.

The descending tops are caused by the smart money off-loading their usually very heavy holdings into the hands of less well-informed and usually very enthusiastic amateurs. At each top, the smart money’s profit-taking soon overwhelms the enthusiasm of other, usually smaller, investors causing the price to drop. The smart money then withdraws to allow the market to recover and investors to become excited again. When the price approaches the previous high, they begin selling again and the pattern is repeated.

As you can see, with Bitcoin, the level of enthusiasm has been strong enough to permit no less than 5 consecutive descending tops, but the most recent was characterised by an exhaustion gap which shows that the buying energy is now dissipating.

It is also important that on Friday last week, Bitcoin fell to $54069 – breaking clearly down through the 200-day simple moving average. Many less-sophisticated investors use the 200-day moving average as a key determinant – so we believe that, while there are bound to be rallies, there will not be any further notable tops.

Our advice remains what it has always been regarding cryptocurrencies:

“If you have them, sell them; if you don’t have them, don’t buy them.”  


DISCLAIMER

All information and data contained within the PDSnet Articles is for informational purposes only. PDSnet makes no representations as to the accuracy, completeness, suitability, or validity, of any information, and shall not be liable for any errors, omissions, or any losses, injuries, or damages arising from its display or use. Information in the PDSnet Articles are based on the author’s opinion and experience and should not be considered professional financial investment advice. The ideas and strategies should never be used without first assessing your own personal and financial situation, or without consulting a financial professional. Thoughts and opinions will also change from time to time as more information is accumulated. PDSnet reserves the right to delete any comment or opinion for any reason.


Share this article:

PDSNET ARTICLES

Smart Local Investors

The last two months have been wild on the markets – mainly because of Trump’s ill-advised, on-again, off-again tariff policies. The issue now is:

Will this morph into a full-blown bear trend? Or is this correction almost over?

From his election victory on the 6th of November 2024,

Jerome Powell

The Federal Reserve Bank (“the Fed”) is completely outside the control of the President and Executive Branch of the US government. The chairman of the Fed is appointed for a renewable 4-year term by the President. The President cannot remove the Chair without cause. The current chairman, Jerome Powell was appointed by Trump during his first term as President and reappointed by

Uncertainty Soars

Investors are by their very nature risk takers, but they are always trying to reduce the risk which they have to take to a minimum. Donald Trump, with his threat of an international trade war and his on-again, off-again tariffs has significantly increased the level of risk in markets across the world. This can be seen in the extraordinary volatility in the S&P500

Liberation Day

Trump has done the unthinkable. He has deliberately engineered the collapse of the US and world stock markets in the nonsensical belief that somehow an international trade war will make Americans richer. Nothing could be further from the truth. His actions have taken the S&P down from its all-time record high of 6144.15 on 19th February 2025 to Friday’s

The Creation of Money

The money supply of a country is a symbol of the goods and services of that country. Obviously, if the size of the money supply is increased more rapidly than the real growth of its economy, then you have more money chasing the same goods and services, resulting in rising prices. Since, over the long term, the only organisation that can create money is the government,

V-Bottom is likely

The 10% collapse of Wall Street, which is a direct result of Trump’s random policy of on-again, off-again tariffs, is very similar to what happened to Wall Street in February/March 2020 when investors tried desperately to accurately discount the impact of the COVID-19 pandemic.

Normally, corrections in the market

The Trump Correction

It is relatively unusual for the activities of American presidents or what they say to have an impact on the New York Stock Exchange, especially during their first 100 days in office. Trump, however, is the exception. His confused, on-again, off-again rulings on tariffs have rattled the market. Markets hate uncertainty and even Trump himself doesn’t appear to know exactly

Dividends

Investors know that the return on a share is made up of a capital gain plus the dividend. Private investors are mostly attracted to the prospect of making a capital gain on the shares which they buy and do not often consider the dividends. What they perhaps do not realise is that a capital gain is actually just the dividend in a different form.

Quarterlies

One of the major differences between the US equity markets and the JSE is that listed companies in America are required to report every 3 months, not every 6 months as they are on the JSE. The quarterly reports of the S&P500 companies are closely followed by investment analysts and predictions are made for their profits.