Market View
J200 104,714.00 -0.49% J203 112,739.00 -0.48% J210 115,272.00 +1.12% J211 126,502.00 -1.69% J212 26,624.00 -0.59% J213 142,695.00 -1.24%
Winning Shares (Top 5)
Code Name Added Price Latest % Gain % Gain/Year
SBP SABCAP 2024-09-27 8100 14550 +79.63% +37.75%
FSR FIRSTRND 2025-08-01 7746 9667 +24.80% +19.59%
KP2 KORE 2024-05-16 20 78 +290.00% +117.09%
SDL SOUTH-PD 2025-09-09 725 1820 +151.03% +130.33%
NPK NAMPAK 2024-06-21 22800 52400 +129.82% +54.59%
Opinions (Top 5)
Code Name Date Action
TFG TFG 2026-11-09 View

The Foschini Group (TFG) is an international retailer of 28 fashion brands. It has 4083 trading outlets in 32 countries around the world. It has a division in London and one in Australia, aside from its extensive presence in the South African market. One of the notable achievements of TFG is that it has managed to establish a successful business in Australia where many other retailers (like Woolworths) have failed.

TFG bought the Retail Apparel Group (RAG) in Australia for just over $300m in 2017. TFG has allowed the Australian management team virtual autonomy in the management of the business and has not attempted to manage it from South Africa. Over the long term, TFG has been a consistent performer in one of the most difficult industries in South Africa, with stiff competition from overseas brands and local clothing retailers.

We regard TFG as the best of the retail clothing companies and it is well diversified overseas which gives it a rand hedge element. Retail is normally very much impacted by the business cycle, but the TFG board has shown its ability to manage the business profitably in many difficult environments where others have failed.

In its results for the six months to 30th September 2026 the company reported revenue up by 0,1% and headline earnings per share (HEPS) down by 6,8%. The company said, "Consumer sentiment and discretionary spend in South Africa remained subdued as higher fuel prices and the resumption of interest rate increases weighed on disposable income". From December 2024 TFG has been in a downward trend.

We believe that this remains a well-managed company but it is in a difficult industry which is highly competitive. Wait for a break up through the 200-day moving average before investigating further. 

PPE PURPLE 2026-11-09 View

Purple Group (PPE) is a trading platform and asset management company that is aimed mainly at the private investor and offers the cheapest costs of dealing in shares on the JSE. The company has three divisions: (1) Easy Equities which enables investors to buy very small quantities of shares with very low dealing costs.

For example, buying R100 worth of a share costs the investors just 64c. 95% of accounts opened are first-time investors and the company has 150 000 active investors. (2) Emperor Asset Management which manages funds on behalf of clients and (3) GT247, a derivatives trading platform.

On 18th May 2023 the company announced the finalisation of its rights issue to raise R105m and already had the support of more than 27% of its shareholders. Shareholders will be offered 10,20567 new shares for every 100 shares that they already hold at a price of 81c per share. The offer is at a 31,87% discount to the volume-weighted average price (VWAP) of the 7 days ending 16th May 2023.

In its results for the six months to 28th February 2026 the company reported revenue up 8,8% and headline earnings per share (HEPS) up 21%. The company's net asset value (NAV) rose 14,9% to 45,35c per share. The company said, "Revenue grew eleven times faster than costs. Within these numbers, the Easy Group continues to do exactly what it was built to do".

In a trading statement for the year to 31st August 2026 the company estimated that HEPS would increase by between 22,3% and 32,3%. The share is well traded with an average with well over R1m worth of shares changing hands daily on average. We advised applying a 65-day exponentially smoothed moving average and waiting for an upward break - which occurred on 4th March 2024 at a price of 66c.

It has since risen to 260c before falling to 184c (5-11-26) as a result of Trump's war in Iran. We believe it still has significant upside potential.

SAP SAPPI 2026-11-09 View

Sappi (SAP) manufactures paper, dissolving wood pulp (DWP) and paper pulp internationally and supplies products in 150 countries. DWP is used to manufacture clothing, packaging products and many other applications. DWP, specialty and packaging products were seen as the profit generator in the future, but until recently, the price of DWP had fallen sharply.

Then in 2021 the price of DWP began to rise as demand from China surged. It is directly linked to the level of consumer spending, and it is well diversified geographically, selling products in 150 countries. The company said that the civil unrest in July 2021 had cut its profit by R220m.

The company has had problems with the backlogs at Durban port and rising energy costs. In its results for the year to 30th September 2026 the company reported revenue down 3% and a headline loss of 69c per share compared with a loss of 15c in the previous period. The company’s net asset value (NAV) dropped 27% to 280c per share.

The company said, "Sappi delivered Adjusted EBITDA of US$294 million for FY2026 in a difficult and volatile operating environment. Management responded to persistent macroeconomic headwinds, geopolitical disruptions and cost inflation". Technically, the share has been in a downward trend since its peak in May 2024.

Its losses have widened. It is essentially a commodity share and hence somewhat risky. 

AII AIMIA 2026-11-09 View

Aimia (AII) is a diversified and specialised chemicals Canadian company listed on the Toronto Stock Exchange (TSE) and in London. It listed on the JSE on 24th February 2026. The company says, "Aimia is focused on acquiring controlling stakes in public and private companies possessing consistent earnings, free cash flow generation and catalysts for growth.  Current group holdings include specialty chemicals company, Bozzetto Group, and ropes and netting solutions company, Cortland International".

In an update on the 3 months to 30th September 2026 the company reported revenue up 21,3% and a headline loss of 0,17c per share compared with a profit of 0,02c in the comparable period. We will wait to see how it performs on the JSE before giving an opinion, but it looks like a rand hedge company that should do well here and attract institutional intereSt. So far it seems to be virtually untraded.

ANG ANGGOLD 2026-11-06 View

06-11-2026 Anglogold Ashanti (ANG) is an international gold producer which used to have operations in South Africa (the last of which, Mponeng, has now been sold), and still has assets in the DRC, Tanzania, Ghana, Mali and the US. It had some significant problems in bringing the Obuasi mine into production and the problems with the Tanzanian government over royalties.

The company has 14 operational mines. Anglogold has retained its listing on the JSE despite having no South African assets. In its results for the year to 31st December 2025 the company reported that its cash flow had tripled to a record $2,9bn while gold production had increased by 16% and there was a 45% increase in the average gold price received.

The company said, "Adjusted EBITDA* was a record $6.3bn in 2025, while headline earnings(4) increased 186% year-on-year to $2.7bn for the year (from $1.0bn in 2024), reflecting higher realised gold prices, production growth and disciplined cost control. An interim dividend of $875m, or 173 US cents per share, was declared for Q4 2025.

The payout comprises 50% of free cash flow". In an update on the 3 months to 31st March 2026 the company reported gold production up 1% and a share buy-back program of up to $2bn. The company said, "EBITDA*(4) increased 130% year-on-year to $2.3bn in Q1 2026 (from $1.0bn in Q1 2025), while headline earnings(3) rose 187% to $1.3bn in Q1 2026, or 252 US cents per share (from $447m, or 88 US cents per share, in Q1 2025)".

In an update on the 3 months to 30th June 2026 the company reported free cash flow up 36% to $727m and headline earnings up 58% to $1bn. The company said, "Total cash costs per ounce* for the Group(1) rose to $1,480/oz in Q2 2026 from $1,226/oz in Q2 2025". In an update on the 3 months to 30th September 2026 the company reported gold production of 2,164m ounces and EBITDA up 12% with strong cash flows.

The company said, "Our Q3 2026 performance highlights AngloGold Ashanti’s structural quality and free cash flow* generation". Technically, the share has been rising since March 2024 in what looks like a volatile upward trend. This share remains a speculation on the gold price - which is strong at the moment.

On 2nd October 2026 the company was censured for not publishing its financial statements on time.

Winning Share: FSR
Opinion: AII
Democrat Sweep  (2026-11-09)

It seems fair to say that while most analysts and investors expected the Democrats to do well in the US mid-term elections, most were also caught completely off-guard by the extraordinary extent and depth of that win - and this has resulted in a burst of increased volatility in the markets as they…

It seems fair to say that while most analysts and investors expected the Democrats to do well in the US mid-term elections, most were also caught completely off-guard by the extraordinary extent and depth of that win - and this has resulted in a burst of increased volatility in the markets as they adjust to the new reality. Trump’s decision to appoint Stephen Miller as his Chief of Staff shows that he has no intention of moderating his position by working with the Democrats – instead he is doubling down on the extreme right-wing politics which has made him so unpopular.

The initial reaction to the vote was undoubtedly one of relief and euphoria as the Democrats claimed first the House and then the Senate. Then the next day that excitement gave way to fear that they might use their now overwhelming power to somehow curtail or limit AI and the build out of data centres across America.

This led, the next day, to a massive 4,4% drop in the S&P500, completely wiping out the gains of the previous day and taking the NASDAQ particularly, down sharply. Voters and newly elected officials have already passed dozens of local measures restricting data centres (from outright bans to temporary moratoriums), while incoming governors in states like Texas and Georgia have signalled plans to pause or heavily regulate new construction.

Hyperscalers and data centre operators have been funding massive expansions with heavy borrowing and private credit. Rising AI credit costs and heavy debt loads have sparked fears among investors of financial strain, stranded assets, or potential defaults if demand falls short. What if the direction of the technology changes and these huge investments are suddenly irrelevant and there is an unsupportable overhang of debt and abandoned assets?

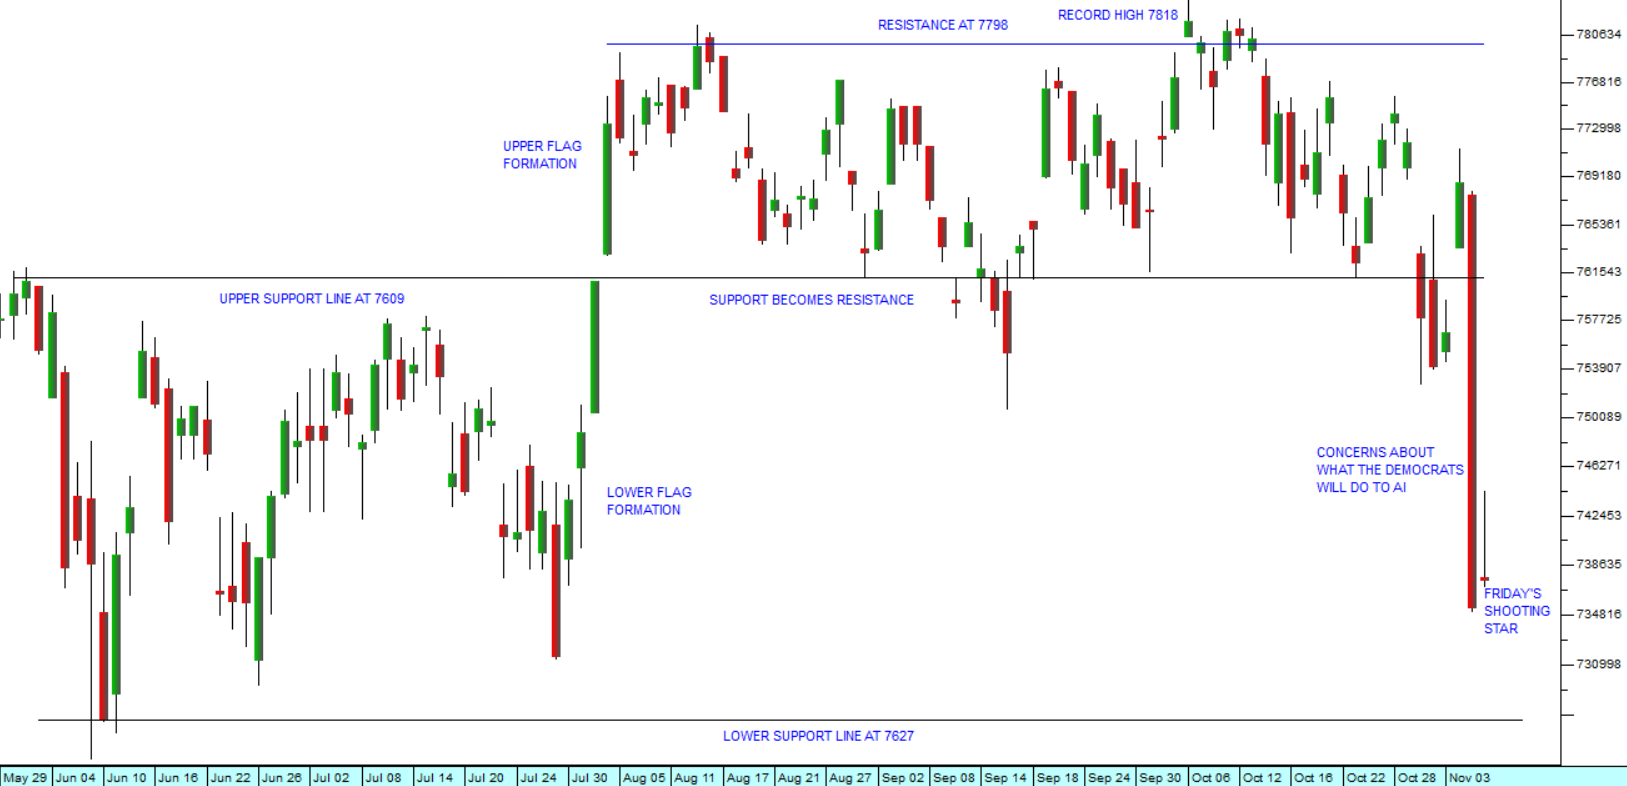
Those fears, added to the fact that tech shares were very already high and due for some kind of correction, has led to a rapid rotation out of AI and into other sectors or into cash. Consider the chart:

S&P500 Index : 29th of May 2026 - 6th of November 2026. Chart by ShareFriend Pro.

Of course, the Anthropic IPO is due to happen on 19th November 2026 and their prospectus has already been issued. They are looking to raise between $80bn and $100bn off a market valuation of between $1,5tr to $2tr. That will now almost certainly have to be curtailed – possibly to as little as $1tr. While Anthropic showed explosive growth - posting $16.3 billion in revenue for the first half of 2026 (up 1,300% year-over-year) - it also recorded an $80.7 billion net loss during that same period.

As a private investor on the JSE watching all this unfold on world markets and with our own election results in the background, you must obviously ask how these things will impact on emerging markets and on South Africa in particular. Our markets, and especially the rand have remained remarkably stable throughout the turbulence. The rand weakened, as far as R16,75 to the US$ and strengthened as far as R16,35, and now has settled in the middle ground of R16,51. This shows that the sharp downward move on Wall Street has not resulted in a huge shift towards risk-off among international investors. The smart money is still buying South African high-yield bonds and our relatively cheap high-quality equities.

On Friday, the US markets stabilised with many investors buying the dip and other even going as far as selling put options for a quick gain if the market recovers some of its former balance. However, the  shooting star formation does not bode well for the coming week. From a purely technical perspective, the lower support line on the S&P at 7626 now becomes important. If that is broken then we are in a full-blown correction.

Against this, we look at the underlying fundamentals of the third quarter S&P500 company earnings and feel that, at the very least, the Thursday sell-off was over-done. At this time 88,2% of S&P500 companies have reported and 82% of those have beaten earnings projections while 74,6% beat revenue expectations. This shows that the bull trend has been very well supported by rising profits across the board. In other words, it does not have the look of a bubble in the throes of bursting. But, in these turbulent times, your ultimate protection remains your stop-loss strategy.

Sasol and the Rising Oil Price  (2026-10-26)

Every major event that happens in the world inevitably offers some kind of investment opportunity for the private investor. The challenge is to work out how best to capitalise on it. So, it was with the war in Iran. At the time that the war began with the Israeli and American bombing raids on 28th…

Every major event that happens in the world inevitably offers some kind of investment opportunity for the private investor. The challenge is to work out how best to capitalise on it. So, it was with the war in Iran.

At the time that the war began with the Israeli and American bombing raids on 28th February 2026, we had already been watching the progress of Sasol for some time. The situation in Iran was tense with riots reported and North Sea Brent had climbed back up to $70 per barrel, but we had no idea that the Americans and Israelis were about to launch a bombing attack.

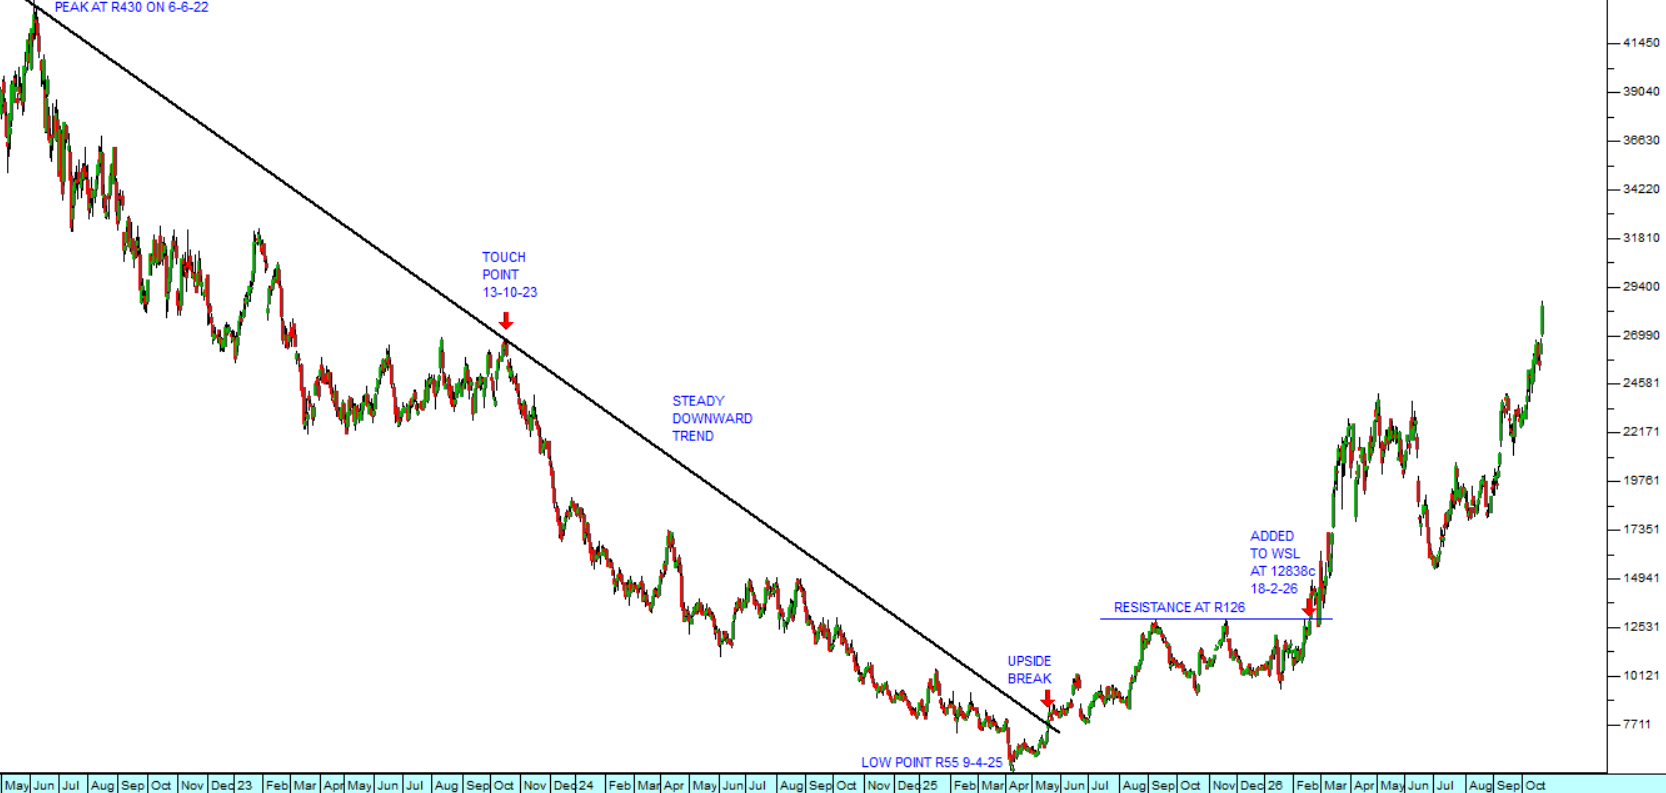
Sasol was always a blue-chip share and has historically occupied a dominant position in South Africa's synthetic fuels industry. It had, however been through some difficult times and the share price had fallen from a high of R430 per share to as low as R55 in April 2025. It then went through an extended period of sideways consolidation. We finally decided to add it to the Winning Shares List (WSL) on 18th February 2026 at a price of R128.36. Technically the share broke above resistance at R126 indicating that something was afoot. Consider the chart:

Sasol (SOL) : May 2022 - 23rd of October 2026. Chart by ShareFriend Pro.

The chart shows Sasol’s long downward trend that began in the middle of 2022, mainly because of the falling price of various grades of oil. North Sea Brent oil fell from a high of $125 per barrel on 8th March 2022 to its cycle low just below $60 per barrel in mid-December 2025. Since Sasol derives more than half of its revenues and profits from the fuel industry, it is directly linked to the price of oil.

Sasol had been recovering but had encountered significant resistance at R126 per share. When it broke decisively above that level, that gave us the signal we needed. Immediately prior to the start of the war the oil price had been climbing, and in January 2026 there were riots in Iran which Trump and Netanyahu used as a pretext to begin the bombing. The price of Brent rose above $70 per barrel on 18th February, before the bombing started, and that triggered a rise in Sasol’s share price. We decided then that Sasol was probably under-valued and due for an upside move.

Sasol’s latest results for the year to 30th June 2026 show the benefits of the rising price of oil. Turnover was up 9% and earnings before interest taxation depreciation and amortisation (EBITDA) was up 17% while the company reduced its debt by 11%.

We do not normally advise investors to buy commodity shares like Sasol because they are riskier, but sometimes they can offer very good capital gains. In the case of Sasol the share appreciated rapidly after we added it to the WSL and then there was a correction as the oil price temporarily fell back in June and July this year. We held on because we thought there might be further upside potential.

The best investment policy is to try to hold onto your shares for at least three years, unless you are moving into a loss position (i.e. you had to execute an early stop-loss sale). This is because if you hold them for less than 3 years the Receiver may seek to declare you to be a share dealer – and then any gain you make will be added to your taxable income and you will be taxed on it at your marginal rate. If you hold for longer than 3 years, then your appreciation is treated as a capital gain for tax purposes and taxed at 18%.

As it turns out holding on to Sasol was the right decision and the share has now appreciated by 134% in about 8 months since we added it to the WSL – which is just shy of 200% per annum.

October Month  (2026-10-19)

There are generally two types of risk in the share market – the risk that a specific share which you have bought falls known as unsystematic risk, and then the risk that the market as a whole falls and drags all your shares down with it - known as systematic risk. The systematic risk that the market…

There are generally two types of risk in the share market – the risk that a specific share which you have bought falls known as unsystematic risk, and then the risk that the market as a whole falls and drags all your shares down with it - known as systematic risk. The systematic risk that the market is in or about to enter a bear trend is obviously a vital consideration for the private investor. During a bear trend about 80% (or more) of shares will fall while only 20% will rise. This means that from a purely statistical point of view it is better for private investors to stay out of the market during bear trends.

It is also very important to be able to distinguish between a correction (which is often a buying opportunity) and a bear trend. The safest approach is always to always buy shares which are rising, in sectors which are rising in a market which is rising. At the same time keeping a strict stop-loss strategy is vital to protect the bulk of your capital. As a private investor you should have an absolute rule that you never lose more than 15% on any share market investment – ever – and that should include your dealing costs. This can only be achieved if you buy free-dealing shares and always adhere to a strict stop-loss strategy.

Today, Monday 19th October 2026 is the exact anniversary of the greatest single day crash in stock market history. Thirty nine years ago, on Monday 19th October 1987, Wall Street collapsed. The S&P500 index fell more than 20% in the day. Other famous bear trends have also begun in October month, including the infamous 1929 crash, the bear trend of the year 2000, the 2008 sub-prime crisis, and the bear trend of 2022 associated with the Ukraine War. So, October month has a bad reputation with investors, and they generally heave a sigh of relief when it is over.

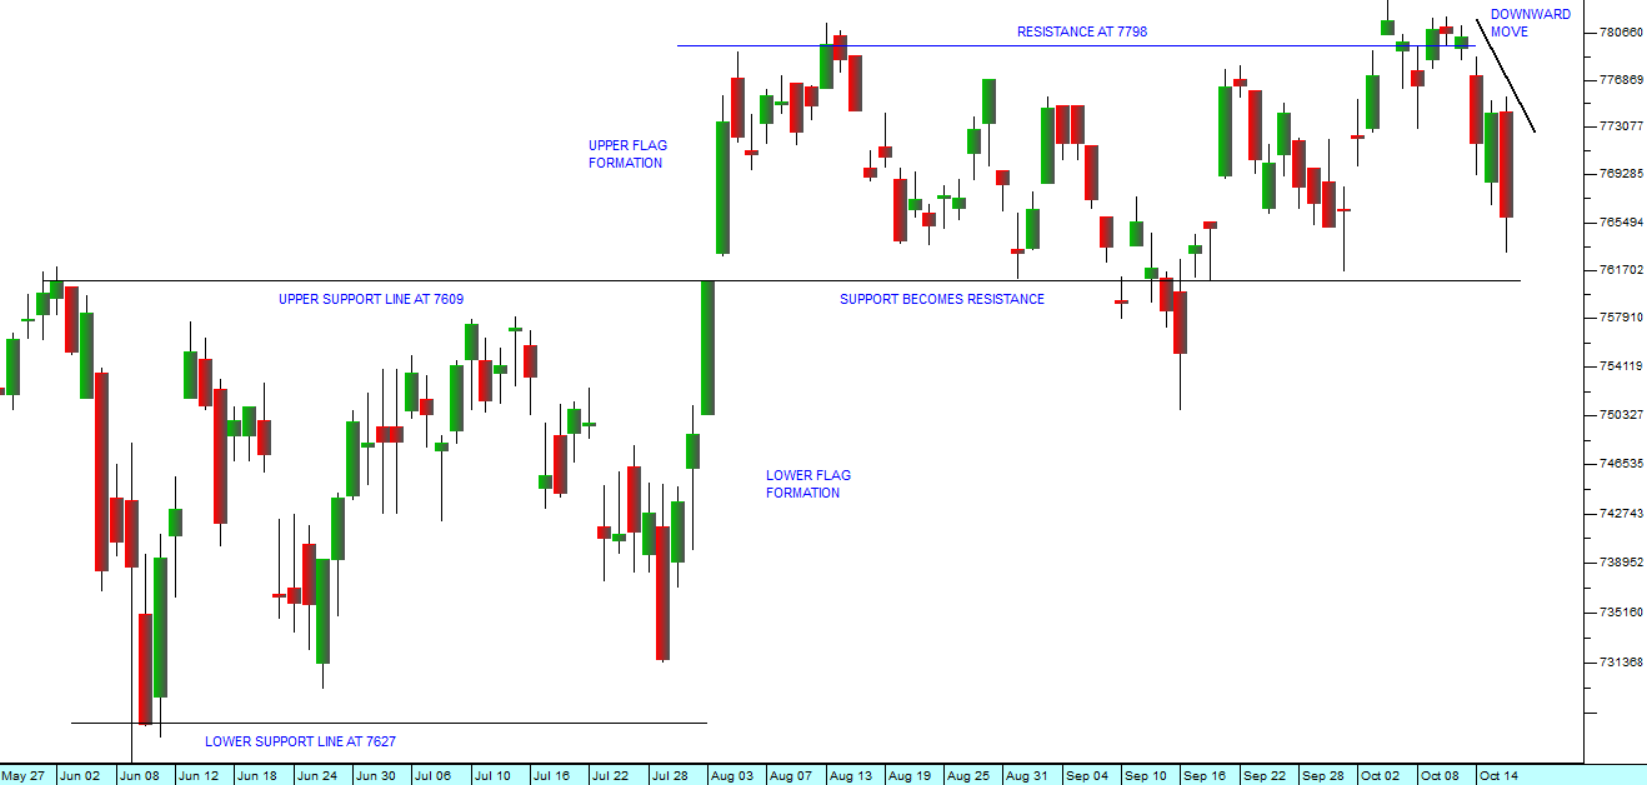
Ominously, Wall Street has been falling over the last week as the Iran war flared up again, pushing the price of North Sea Brent up to nearly $110 per barrel. Consider the chart:

S&P500 Index : 27th of March 2026 - 16th of October 2026. Chart by ShareFriend Pro.

In our analysis, we have drawn your attention to the fact that the S&P500 index has been moving through two sideways markets or flags as the countervailing forces of the rising oil price and the profitability of the artificial intelligence (AI) revolution play out.

The climb in the fuel price is causing a re-evaluation of inflationary risks throughout the world, but especially in America, where the price of petrol has remained stubbornly above $4 per gallon and diesel has hovered above $6 per gallon. With the mid-term elections just weeks away, Republicans and especially Trump are facing a barrage of criticism for their handling of the economy. The Iranians on the other hand are doing everything in their power to keep the oil price at high levels to put the maximum pressure on Trump.

What is notable is that the high oil price appears to be having less and less impact on Wall Street as time goes by. When Trump and Netanyahu began their war with Iran the S&P fell back sharply to 6611 on the 6th of April 2026, and the price of Brent oil went above $110 per barrel. Today Brent is again hovering close to those levels and the S&P has recently managed to reach a new record high at 7818. The world has been facing increased levels of inflation, rising interest rates, and record bond yields - but despite that, AI and corporate profits continue to take the market higher.  

In our opinion, as soon as October month is safely behind us and especially if the mid-term elections have the effect of reducing Trump to a lame dog president, we can look forward to a Christmas rally in the S&P500 during the festive season and into next year. As usual, we strongly advise you to be vigilant and to maintain your stops.

JSE Top 40

104,714.00 (-0.49%)

All Share

112,739.00 (-0.48%)

Financial 15

26,624.00 (-0.59%)

J200
J203
J212
Top Gainers
# Code Name Close (c) % move
1 QFH QUANTUM 890 +27.14%
2 WVR WEAVER 5165 +9.85%
3 TFG TFG 5500 +6.98%
Top Losers
# Code Name Close (c) % move
1 BAC AFBITCOIN 300 -25.00%
2 SAP SAPPI 1125 -13.66%
3 MKR MNTKRENEW 3901 -10.34%

Top Movers – Charts

Top Gainer: QFH
Top Loser: BAC