Triple bottoms
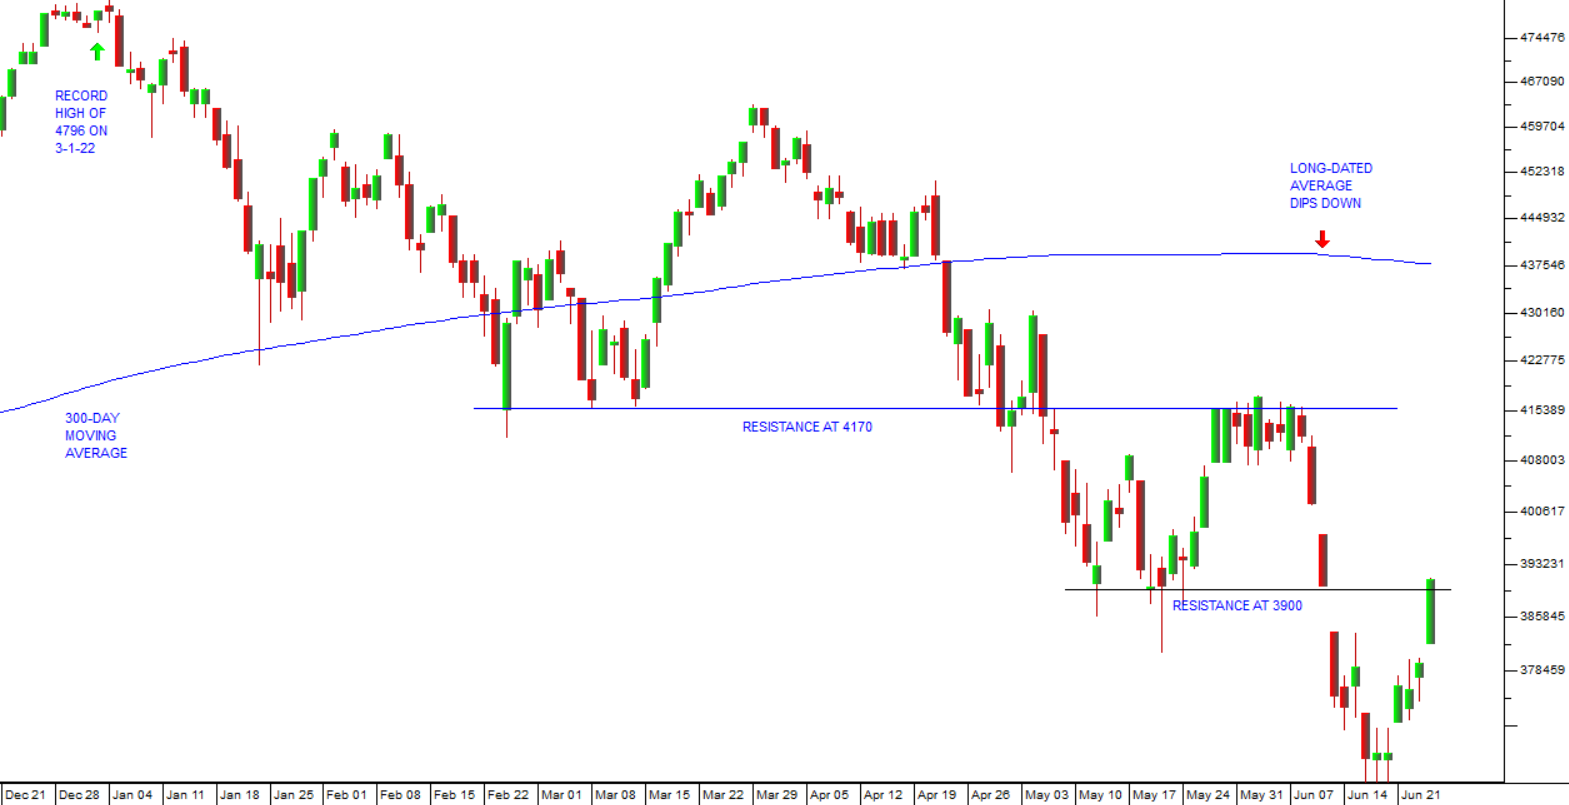
13 June 2022 By PDSNETInvestors should be riveted to the progress of the S&P500 index these days. As we said in our article three weeks ago, the S&P is teetering on the edge of a bear trend. Following that article, the index climbed back up and then on the US Memorial Day weekend it encountered significant resistance at the previous cycle low of 4170. The inability of the bulls to push the index above that level was highly significant and in the three days of 8th, 9th and 10th of June 2022 it was slammed down over 6% to the previous support level at 3900. Consider the chart:
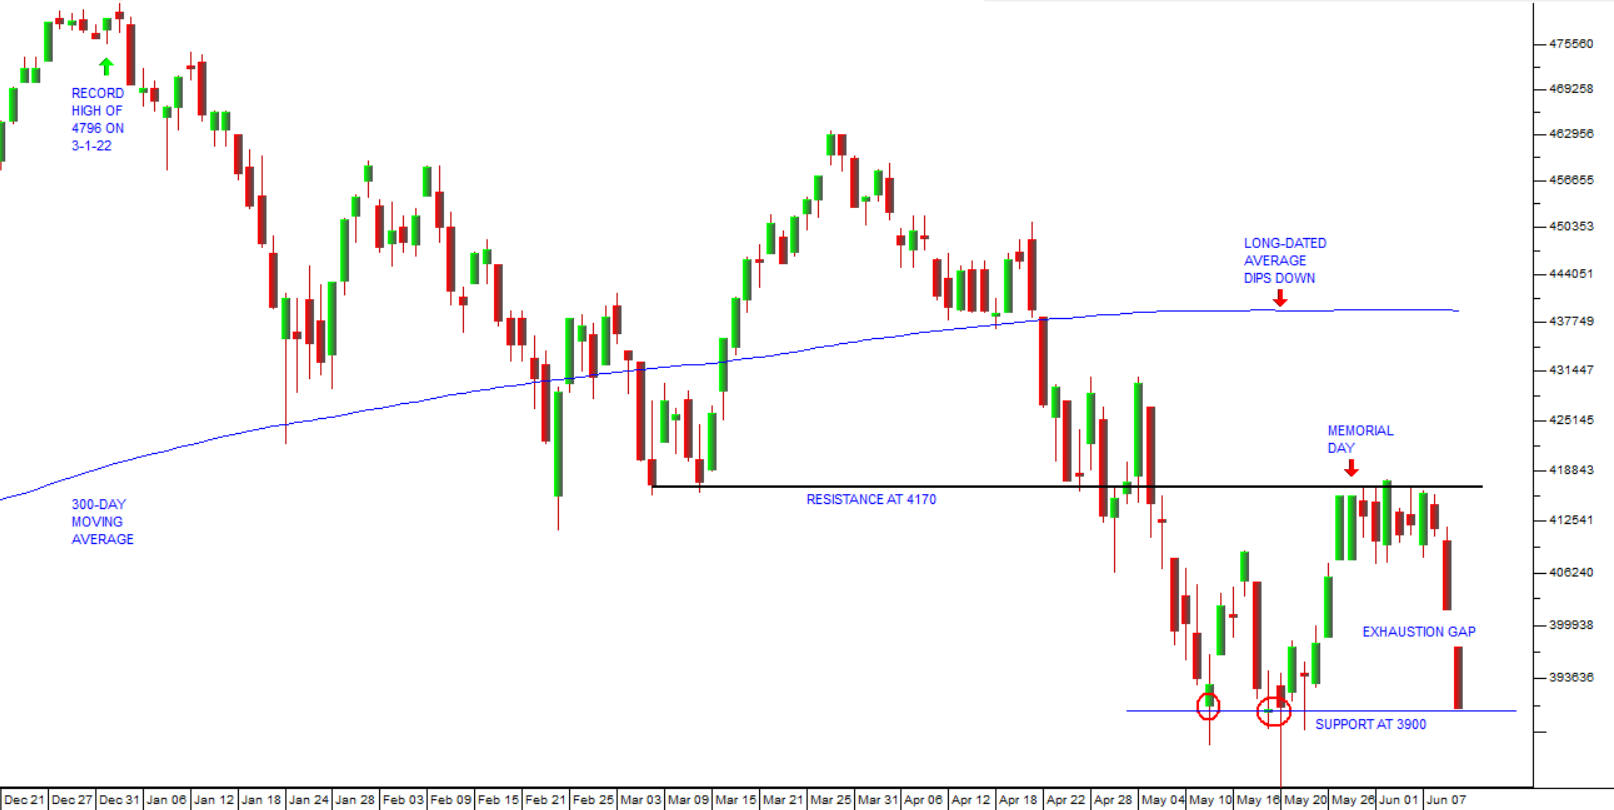
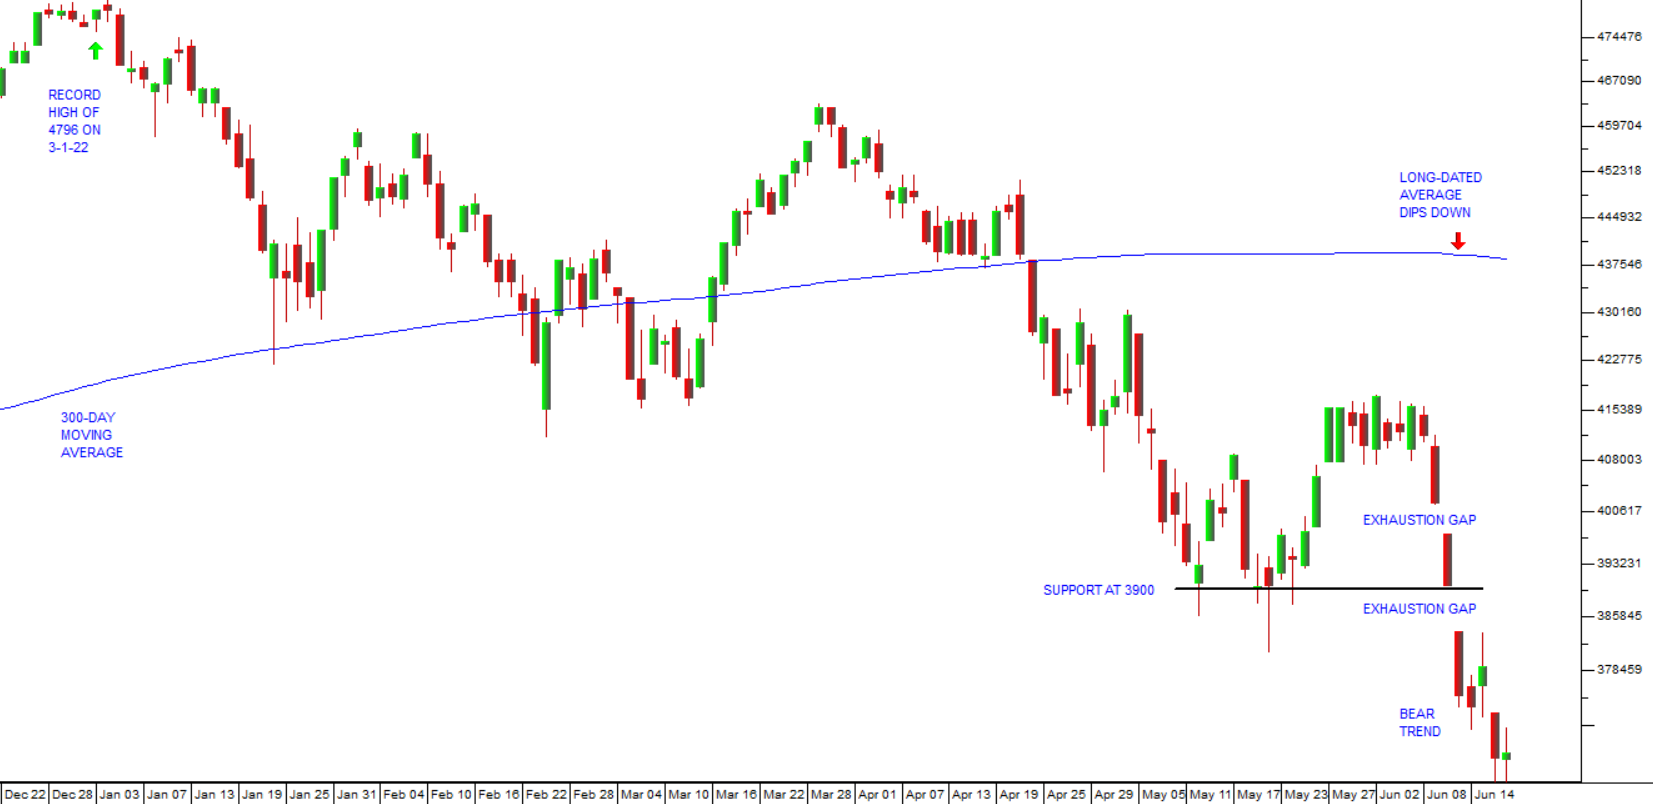
The decline on the index in the last three days of last week included what technicians call an “exhaustion gap” where the opening level for Friday was substantially below the closing price on Thursday. As you can see, by the end of the week at 3900, the index had made a “triple bottom”.
That triple bottom was echoed in the intraday market action on Friday as can be observed from the chart below:
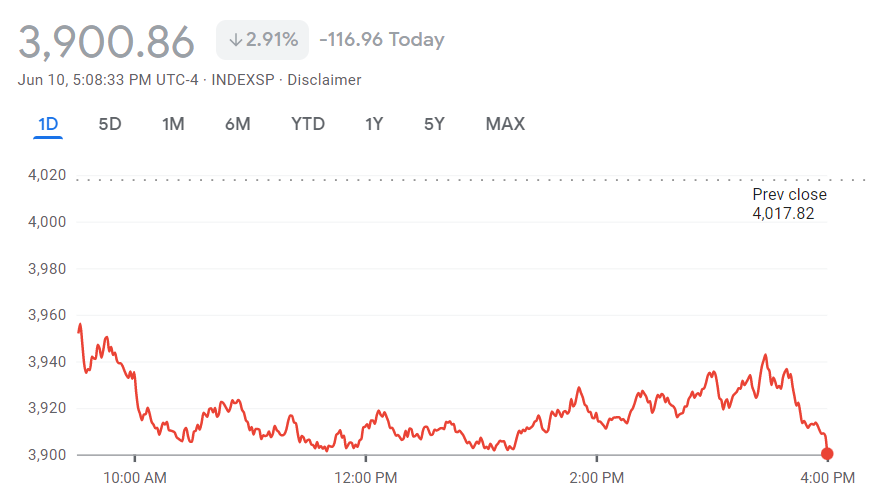
The chart above is available at Google Finance
You can see here the substantial exhaustion gap between where the market opened and the previous day’s close of 4017,82. You can also see that initially, when the S&P reached close to that level of 3900, the bulls pushed it back twice during the day and in the afternoon staged a rally to 3942. Then the inflation figures for May month in the US came out and they were worse than expected at 8,6%. The index was immediately slammed back down to the support level at 3900 by the close.
The 3900 level is 18,7% below the record high of 4796 made on 3rd January 2022 – and so is perilously close to the 20% fall which would confirm this officially as a bear trend rather than simply a major correction.
So, once again, we are on the edge of the precipice. If the market rises off this level, we will have a triple bottom – which is technically bullish – because the bears will then have tried three times, unsuccessfully, to take the market into an official bear trend. On the other hand, if the market breaks down from this level we will certainly be in a bear trend and probably the best place to be will be in cash.
You have to decide for yourself whether this is a buying opportunity or a time to run for cover.
In my experience there are two types of bear trends. The type which begins with a sharp single day collapse (like 1929 or 1987) and the type which drifts out and down over an extended period of time. In these gradual bear trends, there is no single day’s move which is more than 5% - which means that those who want to get out usually have plenty of time to do so. If the market falls 23% in a single day as it did in October 1987, then your stop-loss strategy is far less effective.
What I can say about this downward trend is that, if it is indeed the start of a bear trend, then it is the gradual type and should afford you time to get out without losing much. As it is now, some shares on the JSE have drifted down – but there has been no significant collapse.
Whatever you choose to do at this critical time, you cannot afford to ignore your stops.
DISCLAIMER
All information and data contained within the PDSnet Articles is for informational purposes only. PDSnet makes no representations as to the accuracy, completeness, suitability, or validity, of any information, and shall not be liable for any errors, omissions, or any losses, injuries, or damages arising from its display or use. Information in the PDSnet Articles are based on the author’s opinion and experience and should not be considered professional financial investment advice. The ideas and strategies should never be used without first assessing your own personal and financial situation, or without consulting a financial professional. Thoughts and opinions will also change from time to time as more information is accumulated. PDSnet reserves the right to delete any comment or opinion for any reason.
Share this article: