The Anatomy of the Bear
27 June 2022 By PDSNETAs the bear market unfolds on Wall Street you either hold shares or you are sitting in cash. For those who are holding shares, as we have said consistently, you need to watch your stop-loss levels very closely because you are operating in a market where the odds are decidedly against you.
For those in cash, your position is risk-free, in the short term, but over time your capital will be eroded by inflation. This point was dramatically demonstrated by a recent analysis which showed that you would need R3200 today to buy what you could have bought in 1980 with R100. Your strategy is to try to pick up quality shares when the market hits bottom so the further down it goes the happier you become. The danger is that you will buy back in too early, before the bear has fully run its course.
It is useful to look at what we know about how a bear trend unfolds – although it is worth noting that, because of the wild card of quantitative tightening (Q/T) in the US and internationally, this bear trend will probably not fit the usual patterns.
In a bear trend the probability of buying a share which goes up is obviously considerably lower than it is in a bull trend. It is possible, but it is just far less likely. The safest place to be is in cash.
Over the years investors have developed a number of methods for determining when a bear trend is over. The problem is similar, but not the same, as trying to determine when a bull trend is over. There are always rallies in bear markets as there are corrections in bull markets. The difficulty is to distinguish these short-term adjusting trends from a shift in the long-term direction in the market.
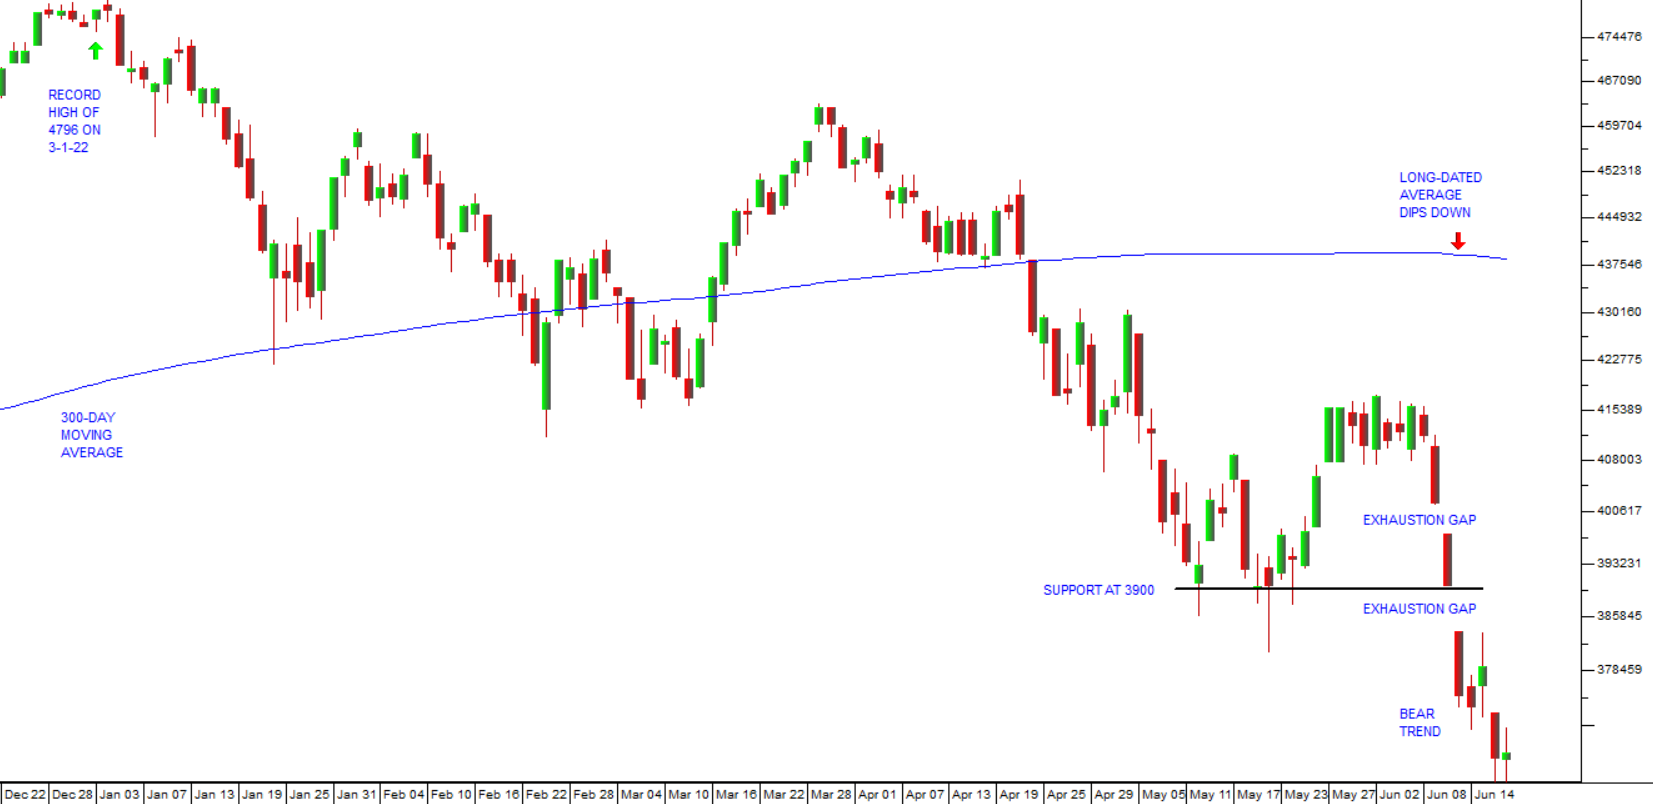
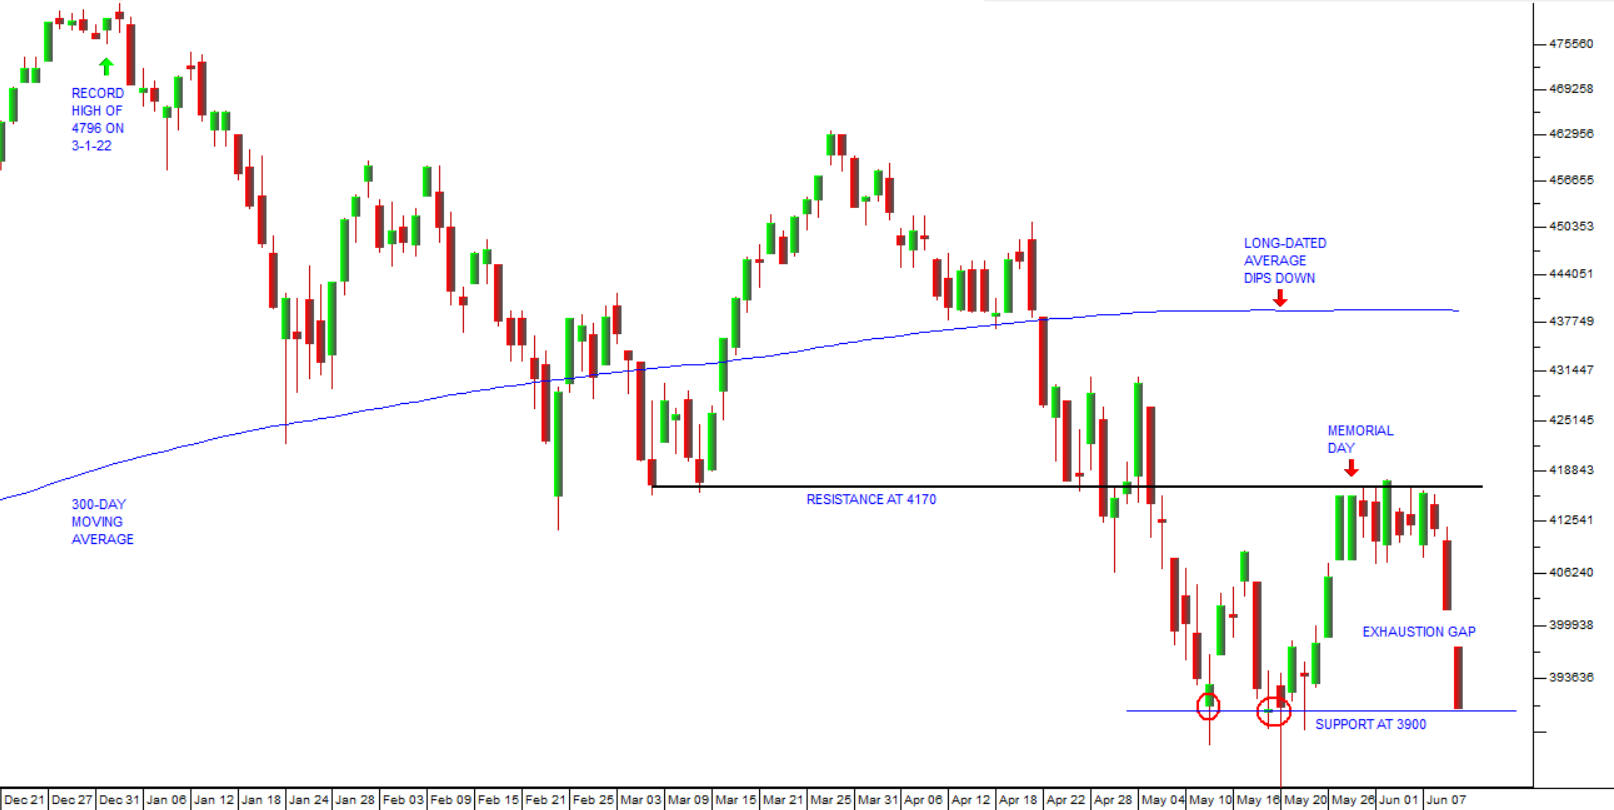
To some extent, previous turning points can help establish support and resistance levels. Consider the chart of the S&P500 over the past six months:
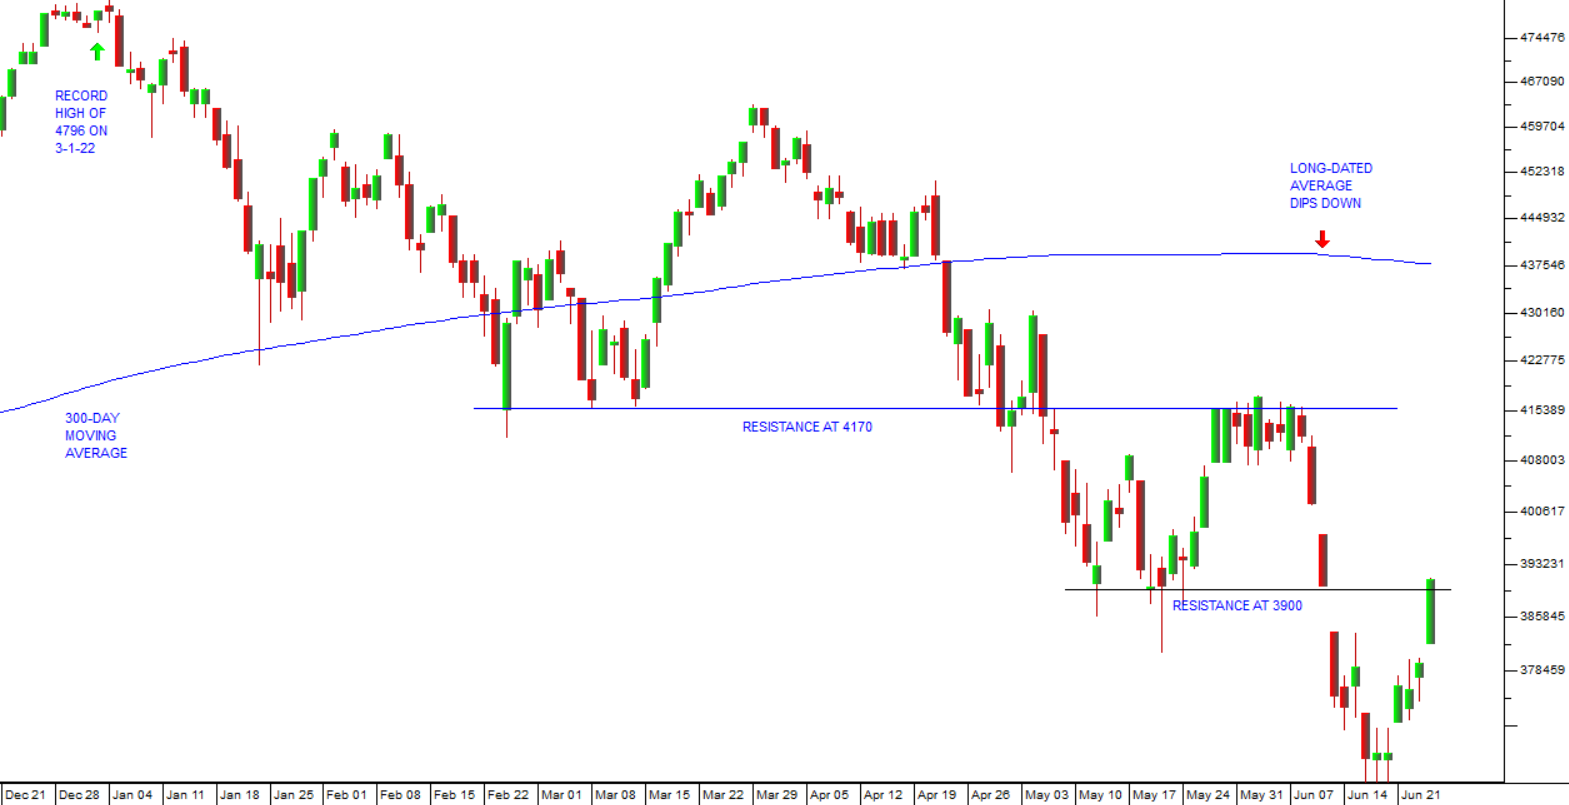
Previous turning points can often be good indications of where the market will encounter resistance. Thus, in the chart above, you can see that there is considerable resistance at around 4170 on the S&P and also now at around 3900. On Friday last week, the S&P rose to 3911 which is just slightly above that 3900 resistance level.
At this point we have to say that the probability that this rally will be short-lived is far higher than the probability that it will be sustained. The 3% jump in the S&P Friday trade looks overdone to us. It came as the chairman of the US Federal Reserve Bank, Jerome Powell, said that, while the Fed hoped to avoid a recession in the US economy, it remains a definite possibility. Somehow, the market interpreted that as meaning that future interest rate hikes would be moderated from the 75-basis points hike of the most recent monetary policy committee (MPC) meeting. More likely, in our view, the market was “grasping at straws” after the punishing downward trend of the previous two weeks. In other words, this looks like a “relief rally” that will probably be reversed in the next week or so. Certainly, it is our intention to remain in cash until we have a clearer indication.
One such sign would be an upward turn in the long-dated moving average of the S&P. On the chart above you can see that the 300-day simple moving average of the S&P turned down on 10th June 2022 when the S&P failed after repeated attempts to rise above the resistance line at 4170. The 300-day moving average has now been falling for 10 trading days – which is a pretty convincing indication that we are in a primary bear trend that will last for some time. The S&P would have to climb back to 4380 to break up through this average – which seems very unlikely, despite last week’s rally.
Of course, South African shares have been doing somewhat better than the S&P500 – as can be seen from the chart below:
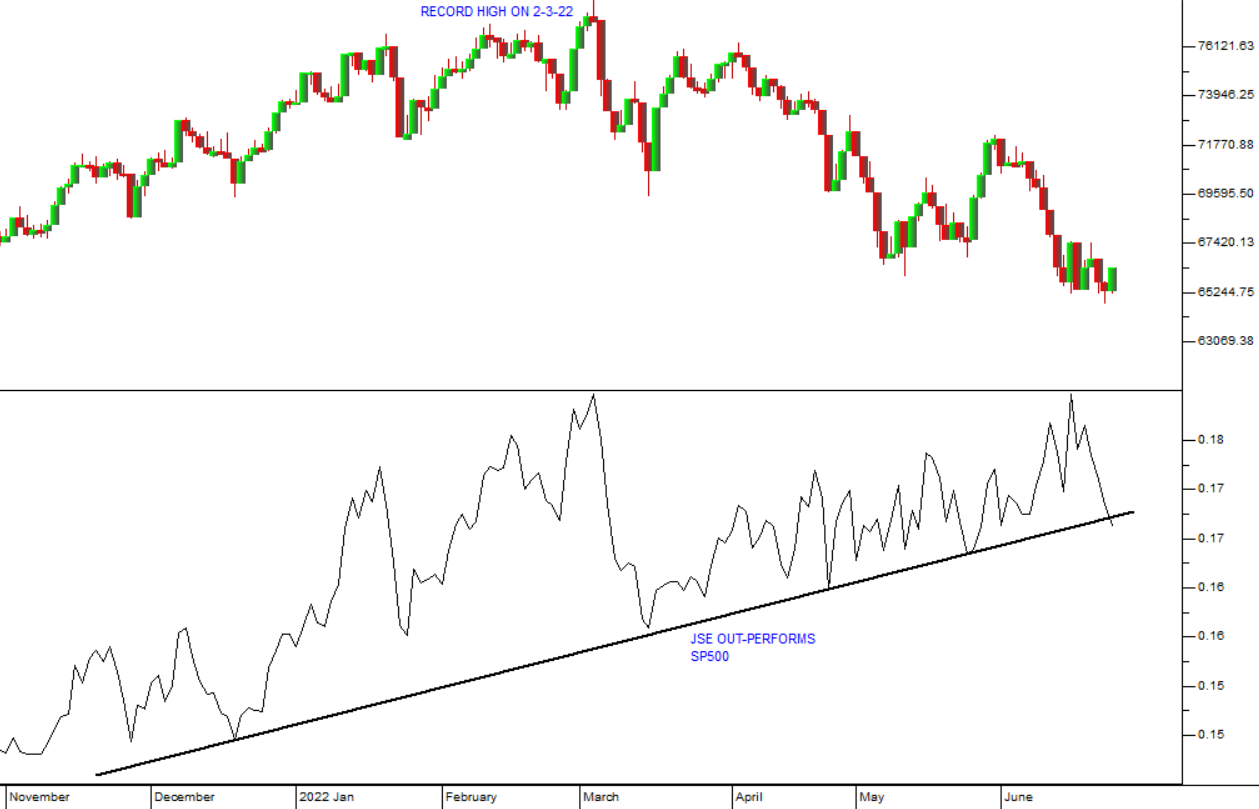
This chart shows the JSE Overall index in the top half and a relative strength chart of the JSE Overall index against the S&P500 in the lower half. You can see here that the JSE Overall index reached its record high a full 3 months later than the S&P on 2nd March 2022 – and you can see that throughout the six months of the downward trend on the S&P, the JSE Overall index has been consistently out-performing it.
In our view, this is not necessarily a good thing. It has tended to lull South African investors into a false sense of security. They are perhaps feeling that the problems in America and Europe will somehow pass us by. This is a mistake. South Africa has an export-led economy and already we can see that commodity prices are beginning to fall in response to the negative news coming out of the world economy. Sooner or later, that downturn in commodity prices will have a direct impact on our economy and when it does the JSE Overall index will, in our opinion, catch up with Wall Street’s bear.
DISCLAIMER
All information and data contained within the PDSnet Articles is for informational purposes only. PDSnet makes no representations as to the accuracy, completeness, suitability, or validity, of any information, and shall not be liable for any errors, omissions, or any losses, injuries, or damages arising from its display or use. Information in the PDSnet Articles are based on the author’s opinion and experience and should not be considered professional financial investment advice. The ideas and strategies should never be used without first assessing your own personal and financial situation, or without consulting a financial professional. Thoughts and opinions will also change from time to time as more information is accumulated. PDSnet reserves the right to delete any comment or opinion for any reason.
Share this article: