Bear Trend
20 June 2022 By PDSNETWe never regarded the COVID-19 fall of the S&P500 in March 2020 as a bear trend. In our view it was always a technical aberration caused by the “black swan” event of the pandemic. It caused a temporary downward spike which lasted from February to August 2020, but it was never a true bear market.
Then on Monday last week it finally happened. After 13 years in a bull trend, the S&P index of the 500 largest companies trading on Wall Street fell into a bear trend. And it did this for economic reasons, because of the anticipated effect of rising interest rates.
This is important because we know from history that during a bear trend, 80% of shares fall. Even if you choose a share which has great fundamentals, during a bear trend, it is likely to be dragged down by the general bearish sentiment in the market. For private investors, this is a time to be out of the market and in cash. At this time, the probability of choosing a share that will go up is greatly reduced.
And the share market is all about probabilities – it is never about certainties. In a bear trend, the probability of it continuing to fall is simply far greater than the probability that it will turn. Gradually, as it falls, share prices become more attractive to potential buyers while sellers become more reluctant to sell. Eventually a turning point is reached.
This point is usually marked by a period of sideways movement when the forces of supply and demand are more-or-less in balance. That sideways market can last for months, and it is characterized by uncertainty and conflicting viewpoints while the news flow is volatile.
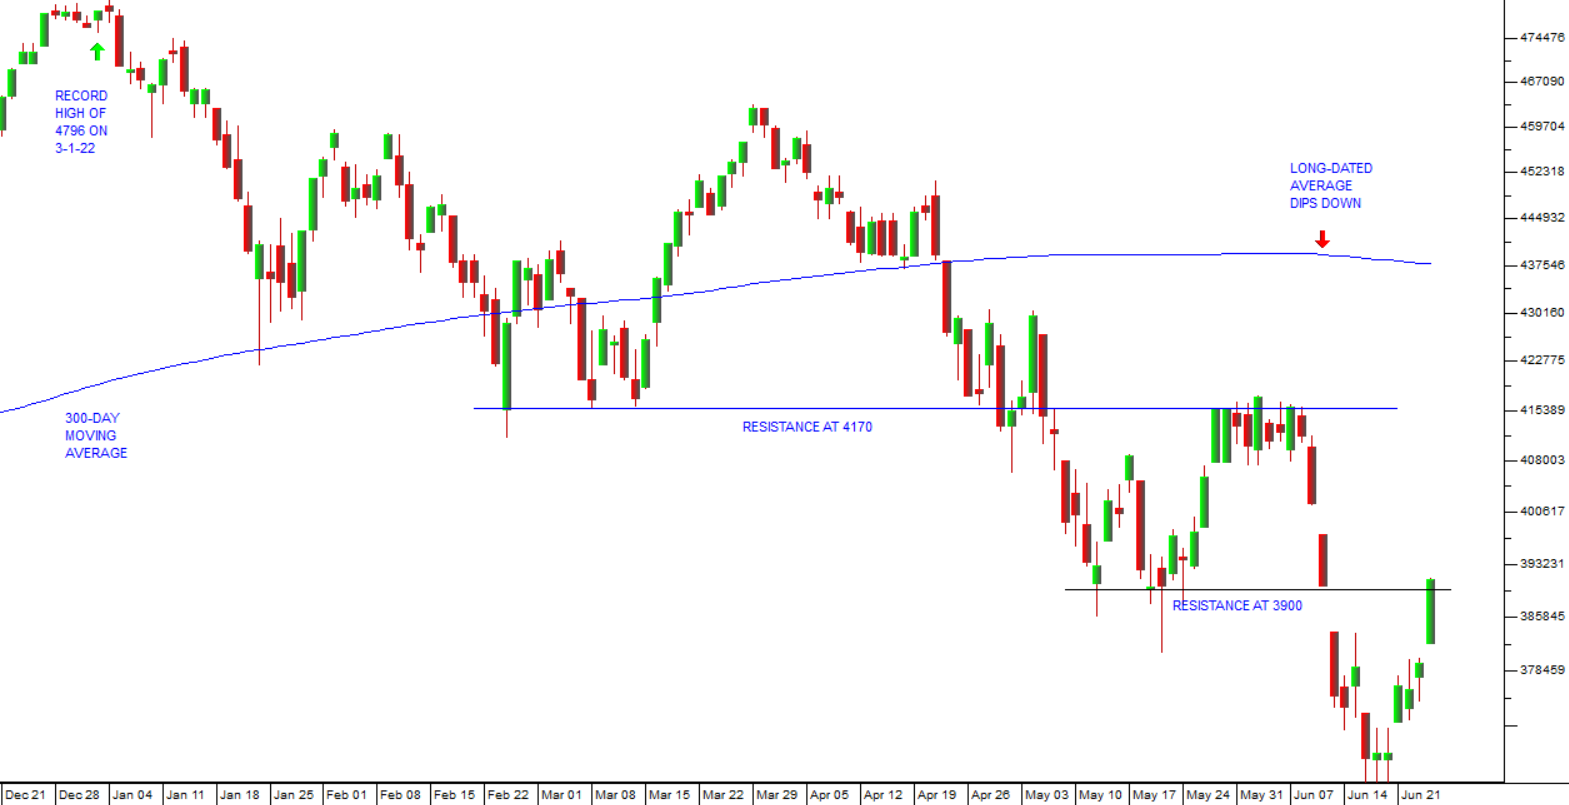
How can you know when the trend has changed? One method is to watch the slope of a long-dated moving average. Consider the chart:
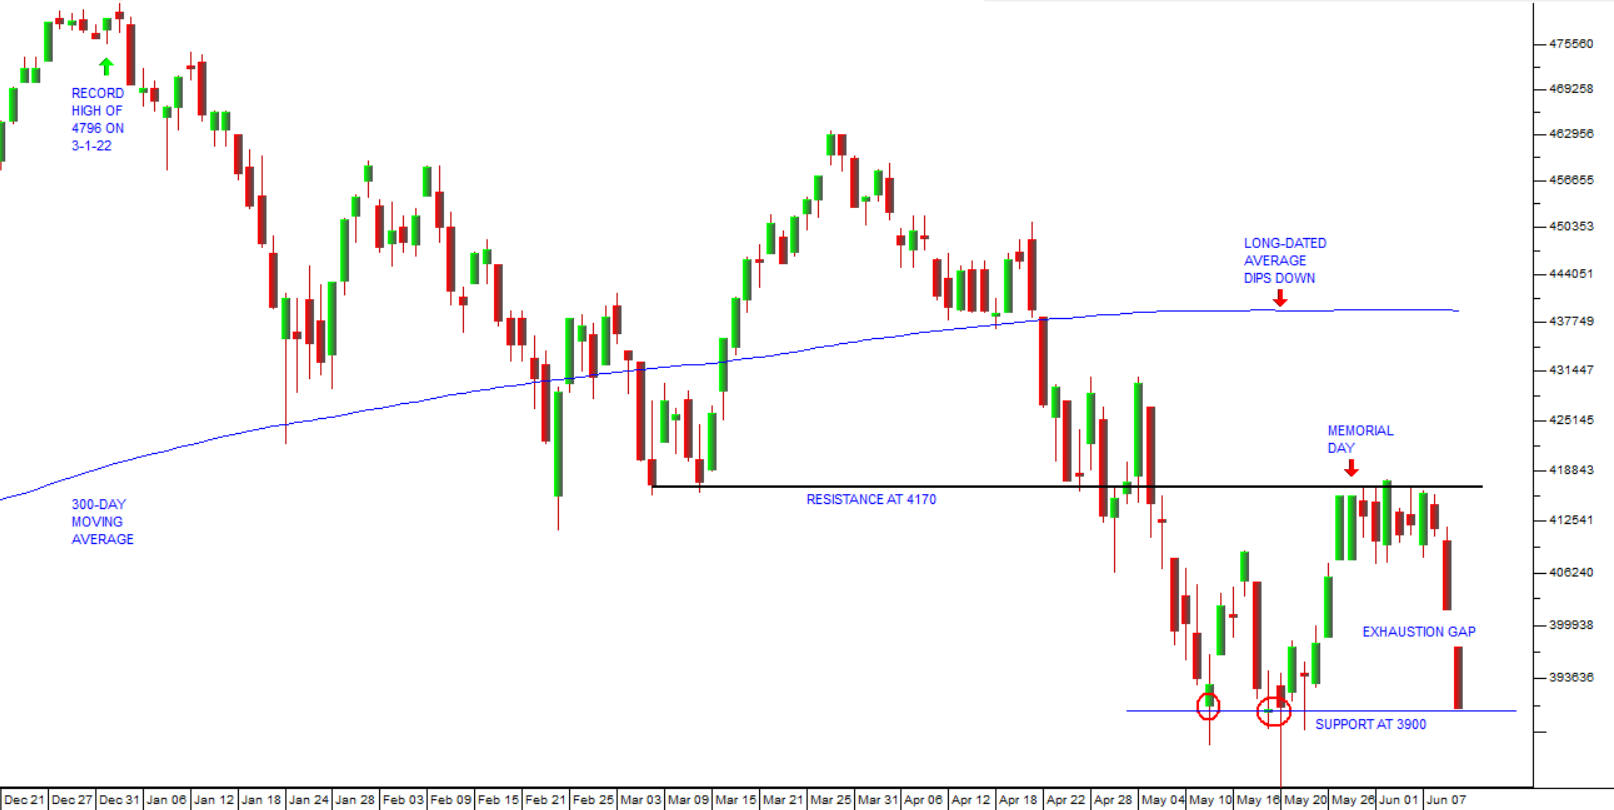
You can see in this chart the record high on the S&P500 on 3rd January 2022. At that time the 300-day moving average was rising steadily indicating that the bull trend was still intact. The downtrend in the index reached a critical point when it failed to break above resistance at around 4170 and moved sideways. That sideways movement was broken by the rapid increase in interest rates in America which resulted in a very sharp sell-off on Wall Street.
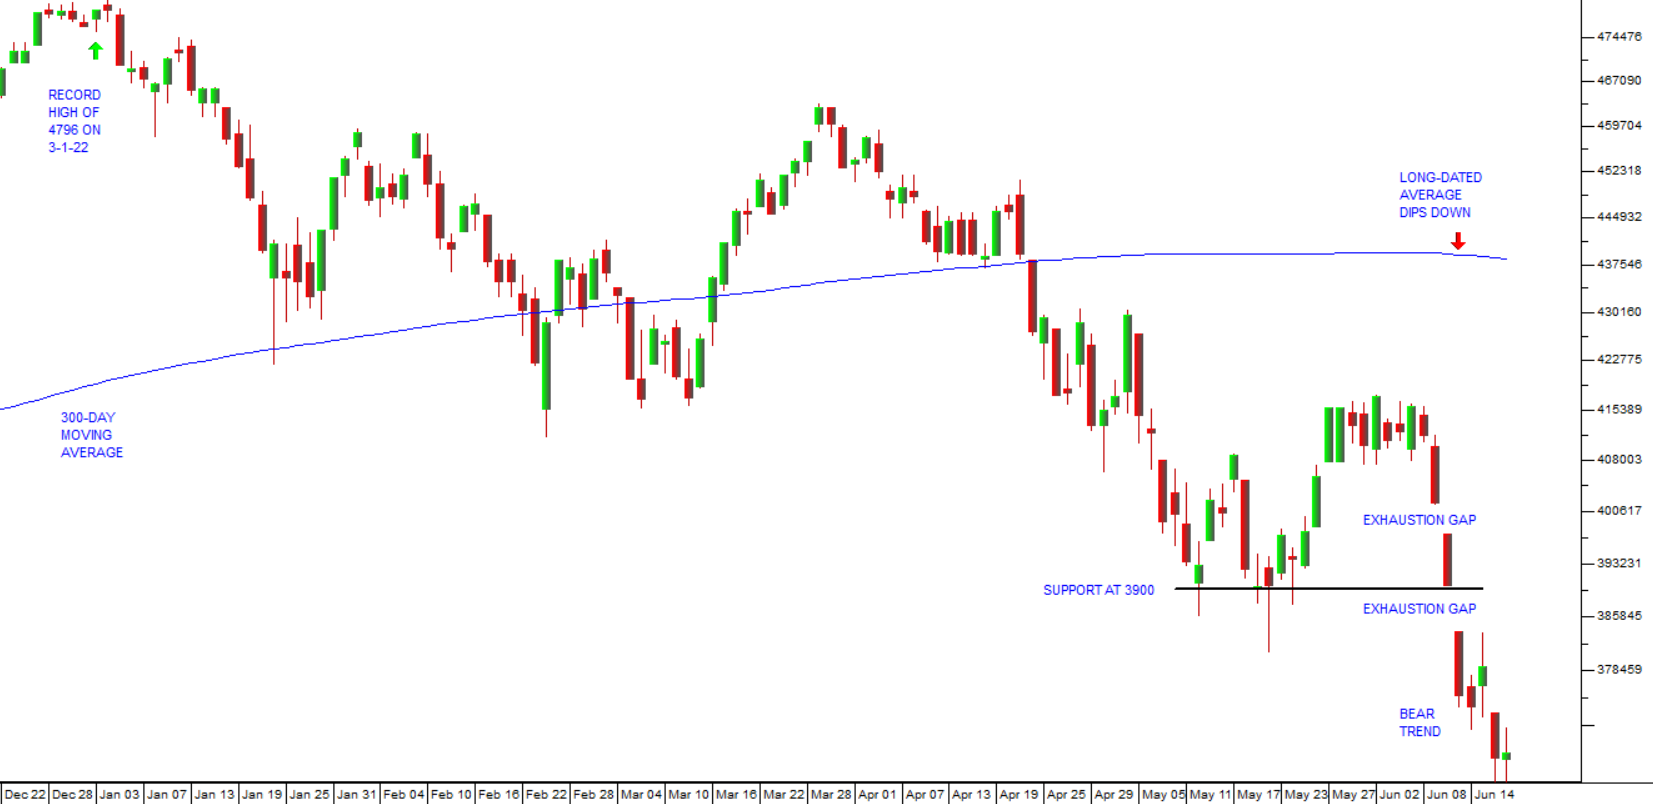
You should note the two “exhaustion gaps” in that downward trend where the index opened considerably below the previous day’s close. On Friday the index closed at 3674 – which is 23,4% below its record high. While the downward trend will be characterized by rallies, you should accept the fact that we are now firmly in a bear trend which could last for as long as two years or more. The bear trend in 1929 saw the Dow Jones index fall to just 11% of its peak level over a period of about 30 months.
A number of analysts are now predicting that the American economy will fall into a recession in 2023 and we agree. A recession occurs when an economy experiences two successive quarters of negative growth in gross domestic product (GDP). Of course, 2024 is an election year in America and the Democrats will not want to fight it in the middle of a recession and that might impact both fiscal and monetary policy decisions.
Historically, rising interest rates must ultimately bring inflation down to acceptable levels and then the monetary policy committee (MPC) will be able to begin reducing interest rates. The anticipation of the resulting economic recovery will cause share prices to rise leading to the end of the bear trend.
Our advice is to watch the progress of the 300-day moving average because it will be unaffected by the inevitable rallies as the market falls. You can wait for the index to break up through that moving average – or, if you are more conservative, you can wait for the slope of the moving average to begin rising again.
After the sub-prime crisis in 2008, the lowest close on the S&P500 was on 9th March 2009 at an index level of 676. The index broke up through the 300-day moving average on 3rd August 2009 at an index level of 1002 - and the slope of the 300-day moving average turned positive on 2nd December 2009 at an index level of 1109. So, if you adopt this approach, you have to decide exactly how conservative you want to be.
Of course, irrespective of the bear trend, you can choose to buy shares when you see them as cheap at any point – so long as they are “free-dealing” and you have absolute confidence in your ability to sell them when they reach your stop-loss level. The only change brought about by the bear trend now in place is to your probability of being right when making such a call.
DISCLAIMER
All information and data contained within the PDSnet Articles is for informational purposes only. PDSnet makes no representations as to the accuracy, completeness, suitability, or validity, of any information, and shall not be liable for any errors, omissions, or any losses, injuries, or damages arising from its display or use. Information in the PDSnet Articles are based on the author’s opinion and experience and should not be considered professional financial investment advice. The ideas and strategies should never be used without first assessing your own personal and financial situation, or without consulting a financial professional. Thoughts and opinions will also change from time to time as more information is accumulated. PDSnet reserves the right to delete any comment or opinion for any reason.
Share this article: