Ukraine
21 February 2022 By PDSNETWhen you buy shares, you are immediately in the business of forecasting the future. You believe that the shares you have bought will go up. If you thought that they were going down, you wouldn’t have bought them. Your prediction that the share will go up can be divided into two primary areas – the prediction that the share market as a whole will rise (systematic) and the prediction that the particular share that you have chosen will do well within that market (unsystematic).
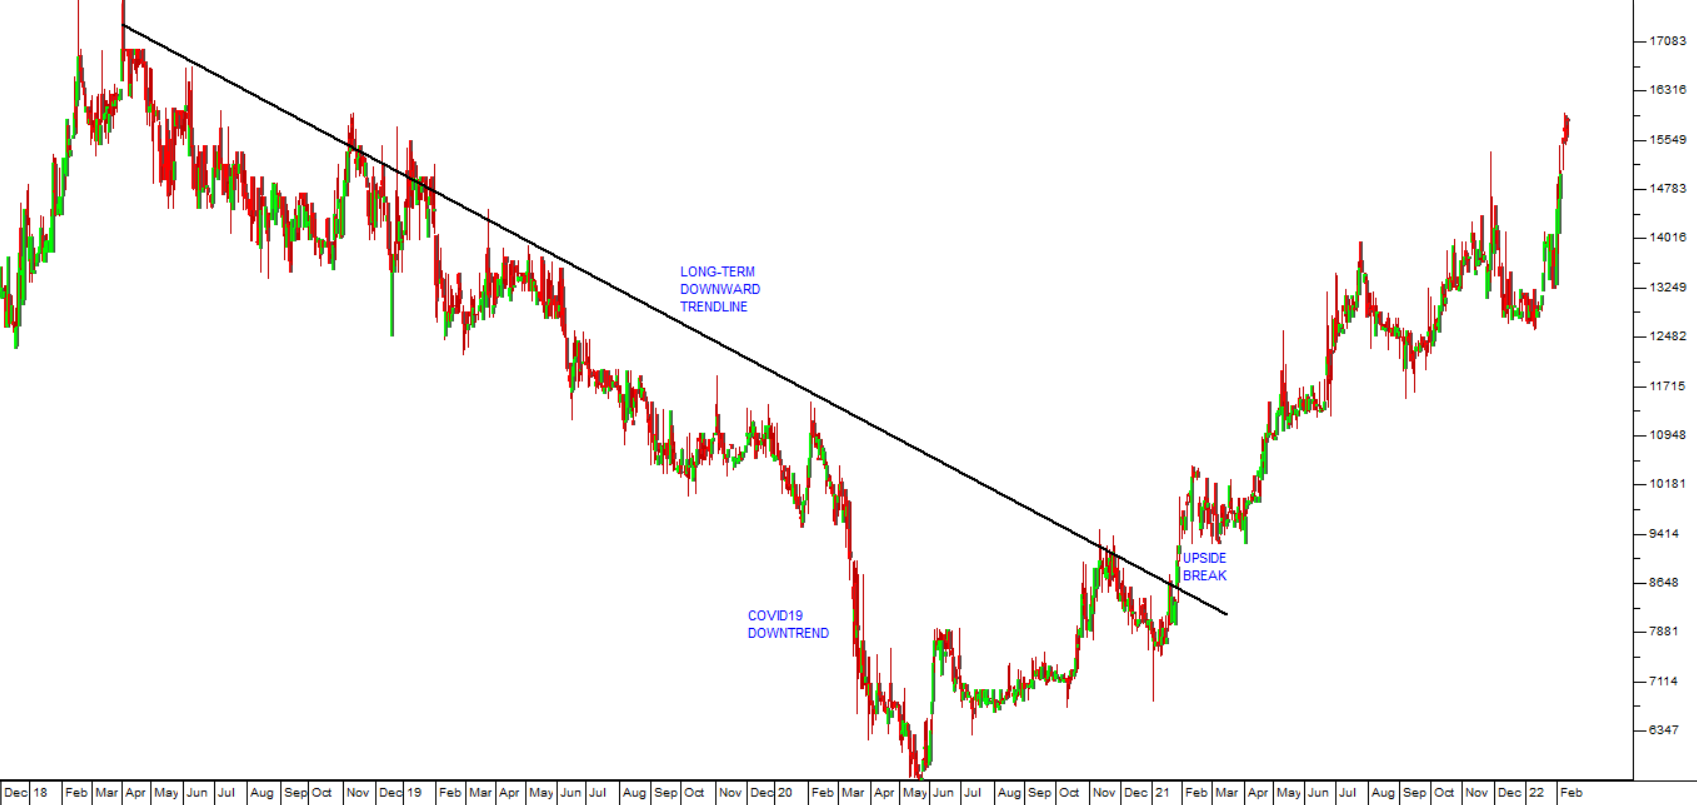
In the Confidential Reports of November and December last year, we predicted that a major correction in the S&P500 of between 10% and 20% was imminent – a systematic prediction. This prediction was based purely on our previous experience of markets generally, which indicates that during a bull trend, such as the one which has been in progress on the S&P500 for the past 13 years, there are always periodic corrections.
At that time, there had been no major correction since the COVID-19 V-bottom in March 2020 – therefore a correction was both necessary and imminent. All that was needed was for the fundamentals to turn negative, which they did when America’s monetary policy shifted from being “dovish” to being “hawkish” late last year. The impact of this hawkishness was easily predictable as US inflation rates rose above 5% and stayed there. When the inflation rate hit 7,5% in January 2022, it was clear to most investors that interest rates would have to begin rising soon - and that, in turn, would eventually result in lower share prices – hence the correction.
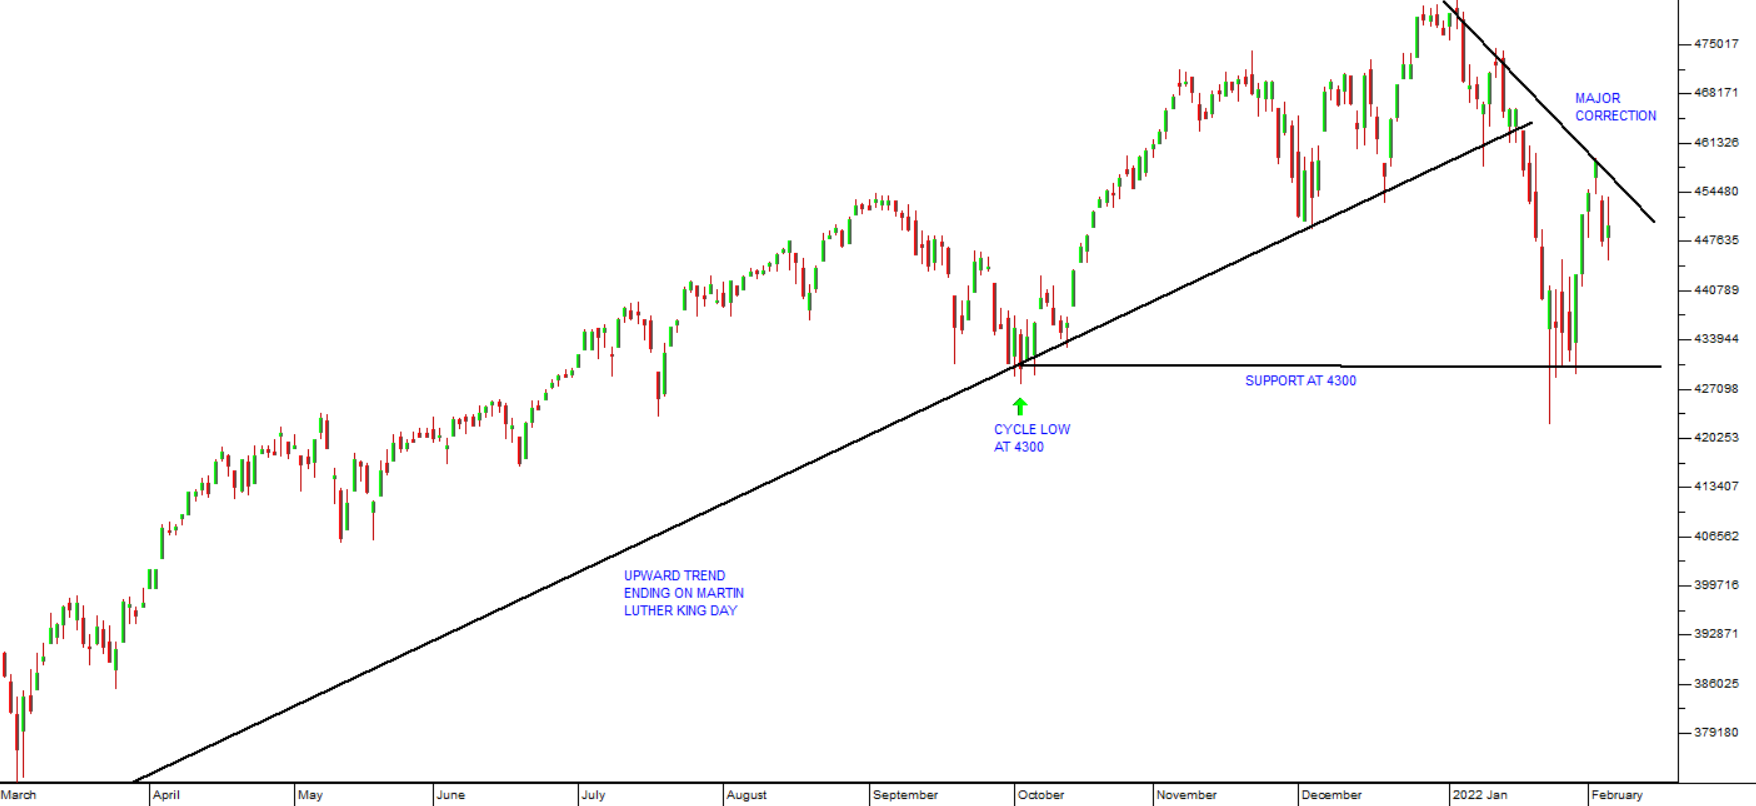
Starting from the record high of 4796.56 on 3rd January 2022, the S&P began to fall in a major correction which quickly took it down 10% on an intra-day basis to the previous cycle low at 4300. Then there was a “dead cat bounce” as bullish investors aggressively began “buying the dip” – a strategy which had been consistently profitable for them over the previous 22 months. Consider the chart:
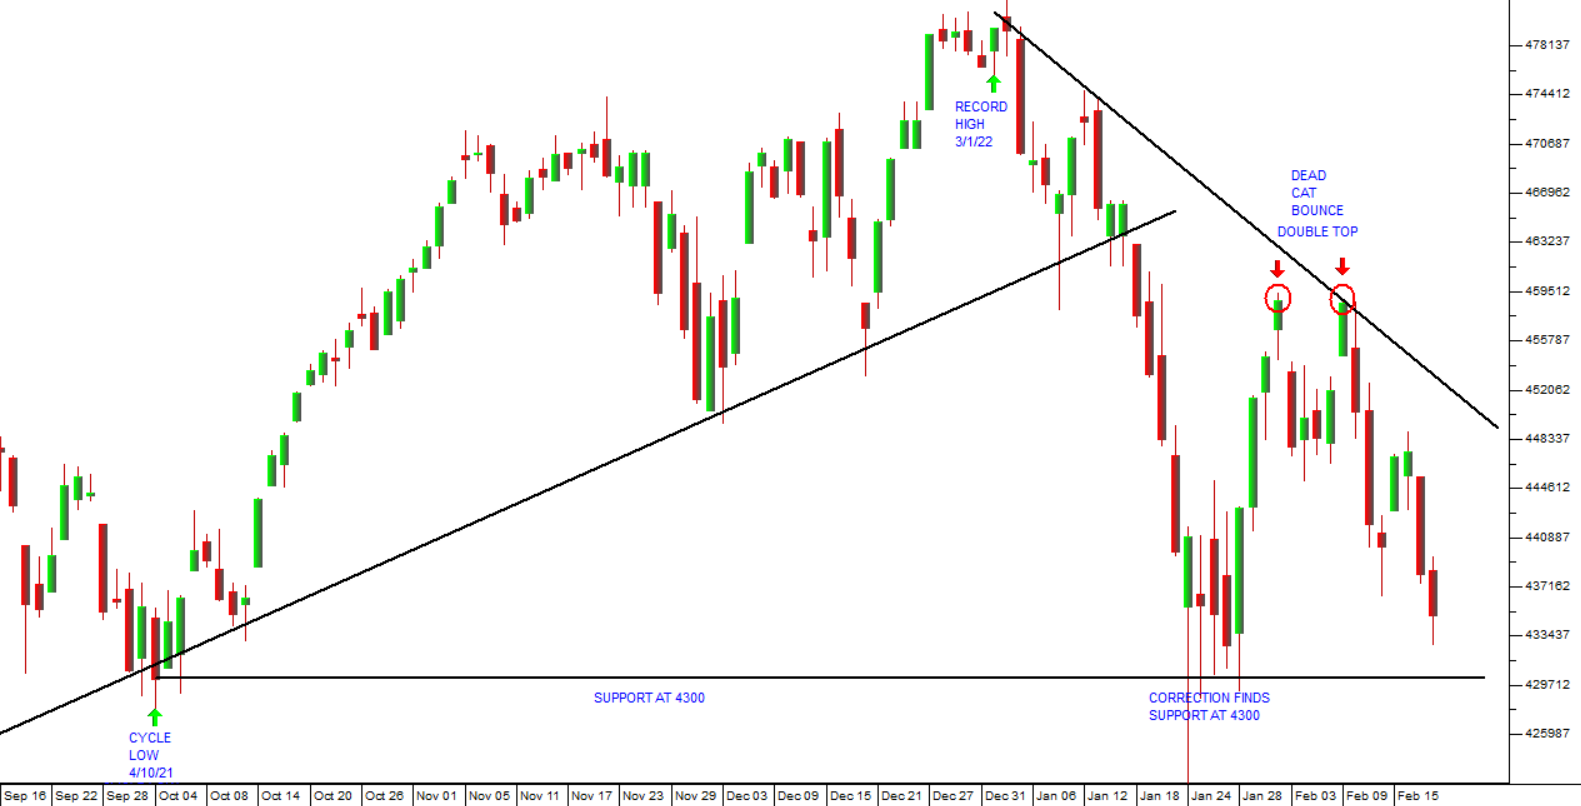
We predicted that the sharp rise in the S&P500 would quickly run out of steam and that the index would fall further towards 4000. After making a “double top” at about 4588, the index has resumed its downward trend towards support at 4300. Our prediction, in our article Market Correction on 24th January 2022, was that the 4300 level on the S&P would be broken and the index would ultimately find a bottom somewhere in the region between 3800 and 4300 – probably at around 4000.
On Friday, the S&P closed at 4348 after falling 0,72% on the day. This downward move was precipitated by the increase in tensions over Ukraine. Of course, we did not know about the Ukraine issue when we wrote our article on 7th February 2022 in which we suggested that the rise in the S&P in the 4 days between the 28th January and 2nd February was a “dead cat bounce” and that the market would fall further.
So how did we know that the S&P would fall further?
It is our experience that major corrections are usually between 10% and 20% - and at that point the S&P was down barely 10% and we did not think it had gone far enough. It is important for you to grasp that the necessary fundamentals, like the conflict over Ukraine, will always appear at the right time to justify and give credence to major technical moves.
So where do we go from here? Our expectation is that there will be further bad news coming out of Europe over the next weeks and months which will result in the S&P falling through the support level at 4300 and down to levels closer to 4000. By that time, the bulls will have fled the scene and it will be the time to look for bargains.
We feel confident that what we are seeing in the markets now remains a correction and not the start of a new bear trend. Therefore, we expect that, once the S&P is below 4300 and somewhere close to or even perhaps just below 4000, a diplomatic solution will be found to the Ukraine crisis and the correction will be over. Markets will bounce back sharply - ultimately resulting in a new record high on the S&P 500 – probably before the end of this year.
So, what can you learn from this? Most significantly, that it is important, from a systematic perspective, to have a clear understanding of the technical position and probable future outcomes for the S&P500 index. Once you have that you will be surprised, and even amazed, at how the fundamentals suddenly appear to justify that technical prediction.
That does not mean that fundamental analysis of systematic risks is a waste of time. An understanding of the deep impact of monetary stimulation in the US and elsewhere, especially quantitative easing and record low interest rates, has enabled us to continuously predict (as we do now again) that the great bull market which began in March 2009 would continue through various corrections.
Rising interest rates, which have not yet begun in the US, will, of course, eventually impact the profits of S&P 500 companies, but we do not expect that to translate into a bear trend until at least the end of next year – and in the meantime we can expect the bull trend to continue with further new record highs on the S&P 500.
Wait and watch – and you will be surprised at how, in a few weeks or months’ time, the news flow begins to suddenly become more positive resulting in markets recovering from this correction. But that time is not now. Now, we can expect further bad news which will take the S&P down through 4300 and towards 4000.
Two interesting points about this correction: Firstly, the gold price has suddenly jumped up to its highest level in 8 months – an indication that international investors are beginning to take the Ukraine crisis seriously. Secondly, the rand has remained remarkably strong – indicating that there has been very little shift towards the “risk-off” sentiment and selling of emerging market currencies, which normally accompanies a fall in the S&P 500.
DISCLAIMER
All information and data contained within the PDSnet Articles is for informational purposes only. PDSnet makes no representations as to the accuracy, completeness, suitability, or validity, of any information, and shall not be liable for any errors, omissions, or any losses, injuries, or damages arising from its display or use. Information in the PDSnet Articles are based on the author’s opinion and experience and should not be considered professional financial investment advice. The ideas and strategies should never be used without first assessing your own personal and financial situation, or without consulting a financial professional. Thoughts and opinions will also change from time to time as more information is accumulated. PDSnet reserves the right to delete any comment or opinion for any reason.
Share this article: