Market View
J200 103,823.00 -1.70% J203 111,565.00 -1.57% J210 124,517.00 -1.95% J211 118,594.00 -2.08% J212 25,455.00 -1.03% J213 135,151.00 -1.56%
Winning Shares (Top 5)
Code Name Added Price Latest % Gain % Gain/Year
SYG SYGNIA 2025-05-06 2380 3199 +34.41% +24.87%
SDO STADIO 2024-06-29 525 1625 +209.52% +93.72%
KP2 KORE 2024-05-16 20 81 +305.00% +129.45%
DSY DISCOVERY 2024-08-01 14280 26278 +84.02% +39.17%
ORN ORIONMIN 2026-01-07 27 28 +3.70% +5.22%
Opinions (Top 5)
Code Name Date Action
PPR PUTPROP 2026-09-24 View

24-09-2026   Putprop (PPR) is a property company which was spun out of Putco (the bus company) and separately listed on the JSE in July 1988. The company owns 16 properties in industrial, retail and office with a gross lettable area (GLA) of 97601 square meters and a value of R1095m.

In its results for the year to 30th June 2026 the company reported rentals and recoveries of R138,1m slightly lower than the previous period and headline earnings per share (HEPS) of 67,1c - up from 60,86c in the previous period. The company's net asset value (NAV) fell to 1500c per share from 1777c.

From a private investor's perspective, the main problem with this share is that it is relatively thinly traded with many days on which there are no trades at all. It is clearly not a share that the institutional investors are interested in. We believe that there are better counters in the property sector.

EPE ETHOSCAP 2026-09-24 View

17-09-2026   Ethos Capital Partners (EPE) is a private equity fund (PEF), incorporated in Mauritius, which invests into unlisted companies for long-term capital appreciation on behalf of its investors. Like most investment holding companies, Ethos trades at a significant discount to its net asset value (NAV).

Fifty-six percent of their assets are in South Africa and 39% in the rest of Africa. It has stakes in Tymebank, Ster Kinekor and Brait. The risk in this company appears to be minimal since it does not invest a significant proportion of its funds in any one investment and its investments have performed well in the circumstances.

It does not pay dividends, so the investor has to look for a capital gain. In its results for the year to 30th June 2026 the company reported net asset value (NAV) down 34% to 562c per share. The company said, "The Initial Public Offering (“IPO”) of the Optasia business on the JSE, with partial sell down proceeds of R360 million".

EPE is well-traded with an average of over R800 000 worth of shares changing hands on average every day. The share has been falling since its high in November 2025, but it may now have found support at around 450c. In our opinion this share, although volatile, should turn out to be a good investment at current levels - depending on the progress of the current trend in world markets.

The separate and successful listing of Optasia on 4th November 2025 resulted in short-lived a jump in the share price. 

AEL ALTRON-A 2026-09-24 View

24-09-2026   Allied Electronics Corp, or Altron (AEL), is an information and communications technology company which was started by Bill Venter in 1965. It has recently been re-focusing on its core business and has sold its 80% stake in Powertech and its 100% subsidiary, Altech UEC (a developer of set-top boxes).

Powertech was also sold to a BEE consortium. Altron is in the process of selling CBI Telecom Cables. Altron operates in six African countries as well as the UK and Australia. The company said it had "...secured key wins in both the public and the private sector...", including the Gauteng Broad Band Network phase 2 contract and FNB's data and analytics contract.

Netstar won the eThekwini 3-year contract for vehicle tracking for 7000 vehicles. Bytes, in the UK, which has now been unbundled and separately listed both in the UK and in an inward listing on the JSE, won a 5-year contract for Windows 10 from the NHS (UK). Altech aims to re-structure its debt to reduce its interest bill and has resumed paying dividends.

They acquired Phoenix Software in the UK for R698m. On 17th December 2020, the company announced the successful listing of its subsidiary Bytes Technology on the London Stock Exchange (LSE) at a price of GBP2.70. In its results for the year to 28th February 2026 the company reported revenue up 1% and headline earnings per share (HEPS) up 34%.

The company said it had an, "Ungeared balance sheet supported by strong cash generation, with cash generated from operations of R1.9 billion and closing cash balance of more than R1 billion". In an operational update for the six months to 31st August 2026 the company reported, "Group EBITDA and operating profit increased by low-to-mid-teen percentages, underpinned by continued operational discipline and operating leverage, enabling the conversion of revenue growth into stronger earnings growth".

In a trading statement for the six months to 31st August 2026 the company estimated that HEPS would increase by between 21% and 27%. The company has no debt on its balance sheet. Technically, the share has been in a strong rising trend, but was moving sideways from January 2025. A new upward trend began in May 2026 with the publication of its results.

The results caused the share price to jump. We expect the upward trend to continue now.

RTO REX-TRUE 2026-09-24 View

24-09-2026   This share is one of the most thinly traded companies listed on the JSE - which makes it completely impractical for private investors in their current form. RTO was established in 1937 and has been listed on the JSE since 1945. It manufactures and markets clothing and accessories through a nation-wide chain of Queenspark and J.

Crew stores. It also owns a portfolio of properties in the Cape Town area. The group is controlled by a consortium led by Marcel Golding and his partner Hugh Roberts. The group recently invested R81m to buy a 33,8% stake in Sembcorp Siza - a water reticulation and specialist pipe services company which operates in Natal.

The company has a very strong balance sheet and has been looking to diversify. In its results for the six months to 31st December 2024 the company reported revenue down 4,5% and headline earnings per share (HEPS) down 3%. The company's net asset value (NAV) was up 3,3% to 2117c per share.

In its results for the year ended 30th June 2036, the company reported revenue up by 9.3%. Headline earnings per share decreased by 48.7%. Net asset value per share icreased by 14.7% to 2339c. Unfortunately, at this time neither RTOs ordinary nor its "N" shares trade sufficiently for investors to become interested.

AOO AF-&-OVER 2026-09-24 View

24-09-2026   This is the holding company of listed company Rex Trueform (RTO) which is also listed on the JSE. Both this share and Rex Trueform (RTO) are extremely thinly traded companies which makes then completely impractical for private investors in their current form. RTO was established in 1937 and has been listed on the JSE since 1945.

It manufactures and markets clothing and accessories through a nation-wide chain of Queenspark and J. Crew stores. It also owns a portfolio of properties in the Cape Town area. The group is controlled by a consortium led by Marcel Golding and his partner Hugh Roberts. The group recently invested R81m to buy a 33,8% stake in Sembcorp Siza - a water reticulation and specialist pipe services company which operates in Natal.

The company has a very strong balance sheet and has been looking to diversify. In its results for the year to 30th June 2026 the company reported revenue up 9,3% and headline earnings per share (HEPS) up 67,7%. The company's net asset value (NAV) increased by 10,9% to 2162c per share.

Unfortunately, at this time neither its ordinary nor its "N" shares trade sufficiently for investors to become interested.

Winning Share: ORN
Opinion: AOO
Using AI  (2026-09-21)

Artificial Intelligence (AI) has been sweeping the world over the past year affecting almost every field of human endeavour. The investment world is no exception. Today the private investor, through AI, has access to a range of analysis which is totally unprecedented and lightning fast. For example…

Artificial Intelligence (AI) has been sweeping the world over the past year affecting almost every field of human endeavour. The investment world is no exception. Today the private investor, through AI, has access to a range of analysis which is totally unprecedented and lightning fast. For example, if you pose the following to Google's Gemini:

“Using a price:earnings growth ratio (PEG), with historical earnings figures over the past 10 years, compare Clicks and Dischem on the JSE for relative value at their current prices”.

A few seconds later, you will receive the following answer:

Based on a 10-year historical valuation framework using the Price/Earnings-to-Growth (PEG) metric, Clicks Group Limited (CLS) offers significantly better relative value than Dis-Chem Pharmacies Limited (DCP), with Clicks holding a PEG ratio of 1,07 compared to Dis-Chem's elevated PEG ratio of 4,92. While both healthcare retailers have faced growth pressures over the past year, Clicks’ consistent long-term earnings growth profile maps to a far more sustainable valuation at current market prices.

It then goes on to say:

To understand the core drivers behind these valuation gaps, we normalize the current trailing Price-to-Earnings (P/E) ratios against their respective multi-year historical Compound Annual Growth Rates (CAGR) in Headline Earnings Per Share (HEPS).

Clicks Group (CLS) — Steady Compounder

  • Robust Growth Track Record: Over the past decade, Clicks Group has compounded its diluted HEPS at an impressive 13,5% per annum, alongside a dividend growth rate of 14,2%.
  • Defensive Cost Efficiencies: Its massive retail presence (~1,000 stores) gives it exceptional operating leverage. At a current P/E of 14,45x, the market has compressed Clicks' historical premium rating (which typically sat closer to 30x), creating a much safer entry point where the earnings growth rate almost directly mirrors its multiple.

Dis-Chem Pharmacies (DCP) — Growth Disruption

  • Earnings Volatility: While Dis-Chem Pharmacies initially listed with immense growth premium expectations in 2016, its long-term financial delivery has slowed down. For instance, its FY2026 annual performance saw a sharp 17,3% drop in HEPS to 113,7 cents due to significant operational and macroeconomic pressures.
  • Depressed Growth Base: Compounding its HEPS from its first full year post-listing (74,7 cents in FY2017) to FY2026 yields a long-term compound growth rate of only 4,78%. A P/E multiple of 23,53x is highly mismatched against this lower single-digit structural growth pace, heavily inflating its PEG ratio.

Risk Guardrails & Framework

Peter Lynch’s traditional benchmark dictates that a PEG ratio near 1,0 indicates a stock is fairly priced relative to its growth, while any metric significantly exceeding 2,0 alerts investors to potential overvaluation relative to realized history. For long-term portfolios, Clicks presents a structurally sound baseline where you are paying a reasonable price for a stable, high-return business framework, whereas Dis-Chem requires aggressive operational margin expansions (such as its automated staffing framework 2.0 initiatives) to justify its present multiple.

This analysis shows that Clicks is cheap at current prices, while Dischem is probably over-priced. Of course, you could have come to the same conclusion if you had done the work yourself, but that would be extremely laborious and time-consuming. For many months now we have been watching Clicks closely. Its price has virtually halved since the middle of last year. And when the price of a blue chip share like Clicks halves, it is always worth investigating.

Of course, before you know to ask such a question you would need to have a basic understanding of how the PEG ratio works or even that there is such a thing as the PEG ratio. Even with the advantage of AI, you need to know enough to be able to ask the right questions – but AI can help you with that too.

We are not suggesting that you let AI make your investment decisions, but we are suggesting that when you find an investment idea it can be a very powerful tool for analysis.

And we do believe that Clicks offers significant value at current levels. Certainly, we believe that it is far better value than Dischem. That is why we asked AI the question in the first place.

Muddy Waters  (2026-09-14)

It has become difficult to keep up with all the news coming out of America. Trump’s erratic behaviour is combining with other factors to make the systematic risk picture complicated and unpredictable. On the one hand, there have been some excellent results coming out of the S&P500 companies riding…

It has become difficult to keep up with all the news coming out of America. Trump’s erratic behaviour is combining with other factors to make the systematic risk picture complicated and unpredictable. On the one hand, there have been some excellent results coming out of the S&P500 companies riding the wave of AI.

AI Boom Lifts S&P 500 Earnings 32% as 86% of Companies Beat Estimates | Business | CryptoRank.io

Wall Street investors now expect that the earnings of the S&P500 companies will be roughly 32% higher than they were a year ago as second quarter earnings dramatically exceed analysts’ expectations. 86% of S&P500 companies have now reported earnings above forecast. Alphabet reported second-quarter earnings that included a $98 billion gain, while Amazon recorded $53.4 billion in non-operating pre-tax income, primarily related to its Anthropic investments. Nvidia’s revenue in the second quarter was $96,2bn – more than double the same quarter last year.  

On the negative side, the price of North Sea Brent oil spiked up to nearly $110 per barrel last week, but has now fallen back to just below $100. This decline to $100 comes because of new hopes for peace negotiations such as planned meetings between Gulf and Iranian foreign ministers. These hopes helped ease immediate fears of a total, prolonged blockage of the Strait of Hormuz. At the same time, oil producers in the Persian Gulf shifted shipments to alternative pipeline capacities and non-Middle Eastern regions (like the US, Canada, and Ghana) which increased output to bridge supply gaps. Finally, major international bodies, including the International Energy Agency indicated that there was slowing consumption and a broader economic slowdown, and notably reduced oil demand from major importers like China driven partly by the transition to electric vehicles.

In the middle of all this, on Tuesday and Wednesday this week the US Federal Reserve Bank’s monetary policy committee will be meeting to decide on the future course of interest rates, and they will be focusing on these figures.

https://coinpaper.com/35641/stock-market-today-sp-500-nasdaq-jump-1-as-oil-falls-despite-hot-cpi

The US inflation rate for August 2026 came in at 3,4% for the year to the 31st August 2026. This was the same rate as July and shows broad increases across both goods and services with the price of gasoline being the major contributor. In the month itself, inflation was 0,4% because of a 3,9% increase in the price of gasoline.

Following hotter-than-expected August inflation data, market metrics and prediction venues show a massive shift toward monetary tightening. The CME Fedwatch Tool suggests that the probability of a 25 basis point hike in  interest rates is now between 84% and 87% while Polymarket says there is an 81% probability. A hike in interest rates will add to the misery of consumers in America already facing an average price across the country of $4.30 per gallon of petrol.

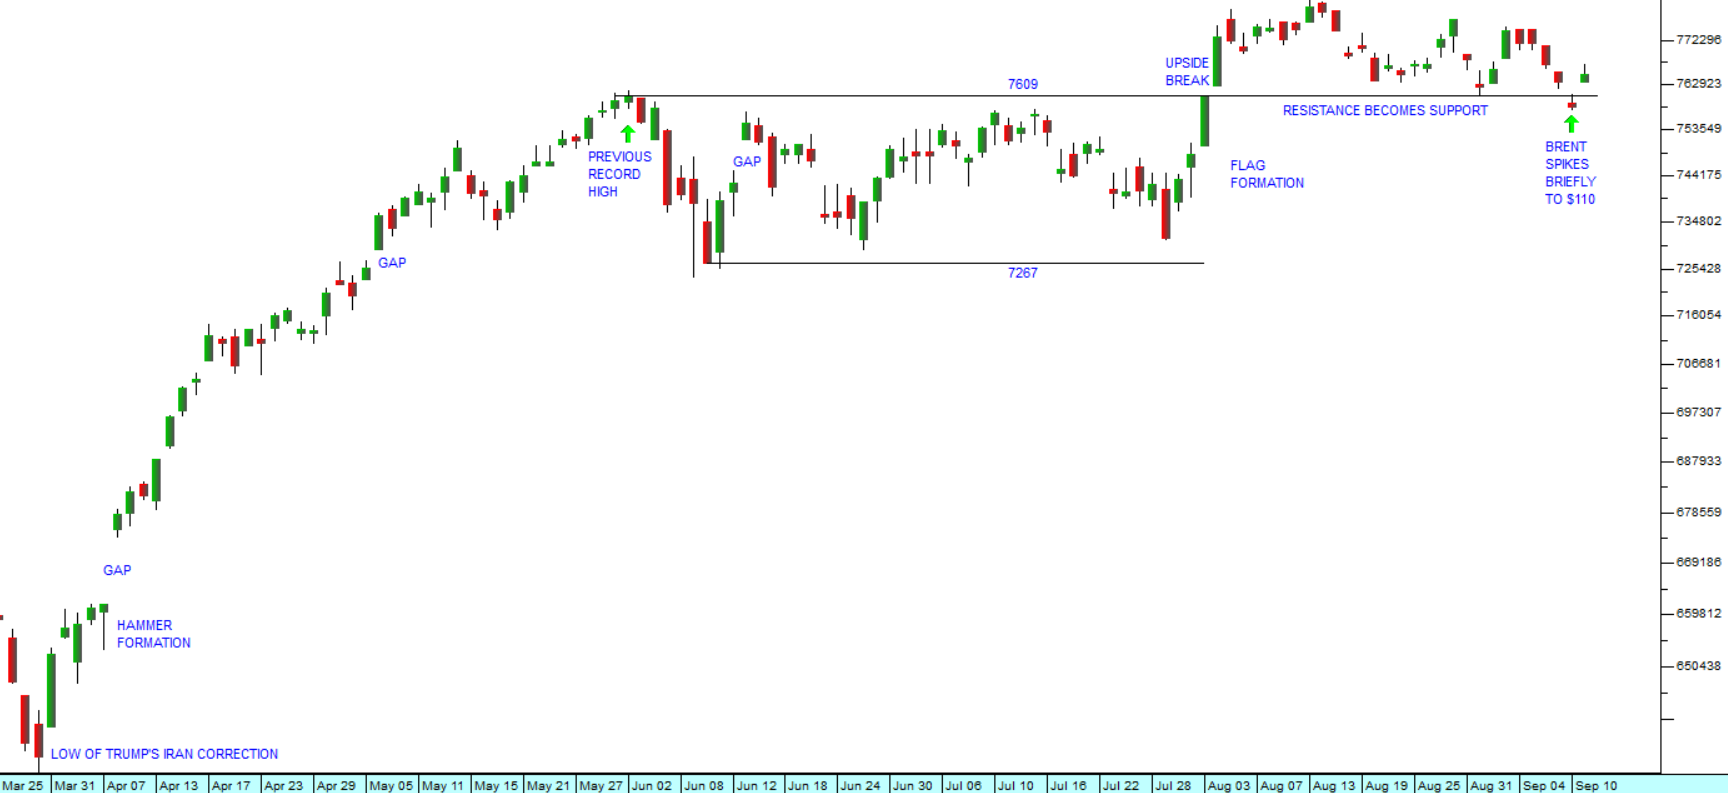
The S&P500 index has been trying to discount all these disparate forces and is basically moving sideways since it broke above the key support/resistance level at 7609. Consider the chart:

S&P500 Index : 25th March 2026 - 11th of September 2026. Chart by ShareFriend Pro.

There can be little doubt about the bullish sentiment which underlies the extended sideways market in the S&P. The news coming from big tech companies appears to be slowly overcoming the bad news coming out of the Middle East. The unexpected spike in the oil price to $110 was short-lived, but it did unnerve the market for a day. That was quickly rectified the next day.

And in the background is the looming mid-term election in America, which is increasingly focusing the Trump camp’s attention, resulting in some radical moves on his part like promising to pay every adult American $5000 if the Republicans win both the House and the Senate. The cost of this is a further $1,23 trillion to be added to the budget deficit already above $40 trillion. He also said that after the elections the petrol price will drop back to $2 per gallon – and anyone who believes that is not following what is happening on the ground.

Trump approval rating hits new low over Labor Day weekend

The Focaldata/Financial Times poll released on September 6, 2026, found that only 32% of Americans now approve of Trump's job performance. Trump's approval rating dropped three points from the previous month, the lowest since the poll series began in May. Critically, his approval among Republicans fell to 72%, a two‑point decline and a new low for that group. The poll was conducted from August 28 to September 2 with 2,178 U.S. adults surveyed. Only 17% of respondents approved of Trump's handling of inflation and the cost of living, while 69% disapproved.

In our view, the Republicans will almost certainly lose the House and the Senate race is now a “toss-up”. If he loses both, we can expect impeachment proceedings to commence promptly.

The S&P500 and markets around the world will ultimately be drawn higher by the AI driven boom in American and elsewhere. We expect new record highs on all indexes in due course.

The Currency  (2026-09-07)

Perhaps the best way to measure the progress of South Africa as a country is to look at our currency – especially against the so-called hard currencies of the Western World. Its strength or weakness gives a very good overall picture of how the country is doing economically, politically and in terms…

Perhaps the best way to measure the progress of South Africa as a country is to look at our currency – especially against the so-called hard currencies of the Western World. Its strength or weakness gives a very good overall picture of how the country is doing economically, politically and in terms of its image with overseas investors.

As an emerging economy, South Africa is not regarded as a poor country, but rather as one which is striving to become first world. For overseas investors this typically means a country and a currency which offers high risk and high potential return. Whereas a 10-year US Treasury Bill can offer the international investor a return of 4,8%, a South African 10-year government bond offers around 8,8% - that is 4% better, if the investor is prepared to take the risk of investing here.

We have a number of advantages over other emerging markets. Perhaps most importantly, we have relatively low inflation. In fact, due to the tireless efforts of Lesetja Kganyago, Governor of the Reserve Bank, our inflation rate is very comparable to many First World countries – and certainly far better than many of the other emerging economies. For example, Turkey’s inflation rate is 31,5%, Argentina is at 33,8% Egypt is at 14,9% and Columbia is at 6%.

We are generally grouped among those less risky emerging economies with lower inflation rates like Brazil (4,6%), India (4,4%), Mexico (3,4%), Indonesia (2,9%), and South Korea (2,8%). These are very comparable to the inflation rates of First World economies like Europe (3,3%), the United Kingdom (2,9%) and America (3,4%).

Approximately $19bn worth of rands are traded in our currency market every day on average. This makes it a highly liquid and very free currency exchange. Overseas investors can quickly take or sell large positions in what is a strong and well-organised market. This has tended to mean that the rand has become a proxy for all emerging economies. When international sentiment is risk-on they pile into our currency and government bonds. When it is risk-off, as it was when Trump began his war with Iran, they sell out quickly.

But overall, for at least the past 17 months the rand has been steadily appreciating against most first world currencies. In our view, this is related to the stabilising impact of the government of national unity (GNU) and the fact that the ANC is no longer in complete control. This together with the various initiatives set in motion by President Ramaphosa have meant that the economic environment has been steadily improving since April 2025.

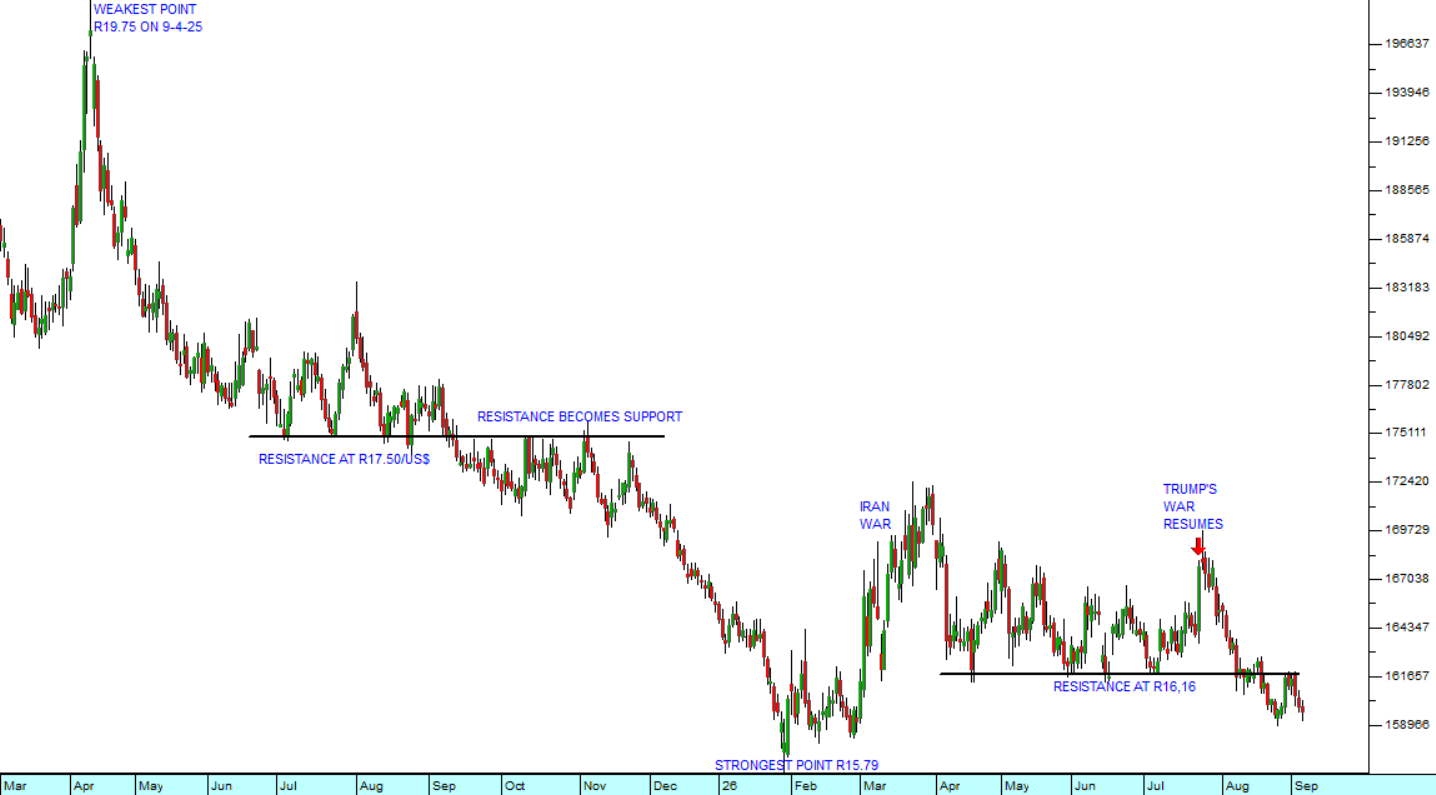
On 10th April 2025 one euro would have cost you R21,90 and today it costs R18,53. On the same day, one British pound would have cost you R25,34 whereas today it costs only R21,56 and of course over the same time period the US dollar has fallen from being worth R19,75 to being worth R15,96. Consider the chart:

South African rand/US dollar : March 2025 - 4th of September 2026. Chart by ShareFriend Pro.

What is significant about this chart is that it clearly shows the steady improvement in international sentiment towards South Africa. The massive, well-informed international investors of the world are betting on our country and putting their money here instead of elsewhere. That is a significant vote of confidence and one which many South Africans caught up in the cut and thrust of daily life here do not appreciate.

In our view, the rand is about to break below its previous cycle low of R15.79 to the US$ made on 29th January 2026. The outcome of the municipal elections on 3rd November 2026 will have a significant impact. If the ANC loses further ground and the DA gains ground (which is what we believe will happen) then you can expect the rand to appreciate further.

A stronger rand is good for everyone in South Africa. It means lower fuel prices, lower inflation, lower interest rates, more stability and a better future for everyone involved in the economy. It is the most telling and reliable indicator of our progress as a nation.

JSE Top 40

103,823.00 (-1.70%)

All Share

111,565.00 (-1.57%)

Financial 15

25,455.00 (-1.03%)

J200
J203
J212
Top Gainers
# Code Name Close (c) % move
1 BAC AFBITCOIN 500 +66.67%
2 SKA SHUKA 85 +6.25%
3 SEB SEBATA 210 +5.00%
Top Losers
# Code Name Close (c) % move
1 EUZ EUROMET 491 -42.24%
2 CNP CANALPLUS 5116 -8.61%
3 NPH NORTHAM 26607 -6.15%

Top Movers – Charts

Top Gainer: BAC
Top Loser: EUZ