Market View
J200 102,553.00 +1.27% J203 110,399.00 +1.29% J210 117,601.00 +0.43% J211 121,494.00 +1.50% J212 25,508.00 +1.94% J213 136,765.00 +1.75%
Winning Shares (Top 5)
Code Name Added Price Latest % Gain % Gain/Year
OCE OCEANA 2026-06-06 6200 6324 +2.00% +5.37%
DTC DATATEC 2024-10-26 3950 5989 +51.62% +26.02%
SBK STANBANK 2025-08-15 24911 31063 +24.70% +20.91%
NPH NORTHAM 2025-05-21 14311 24277 +69.64% +49.16%
VKE VUKILE 2023-12-07 1410 2478 +75.74% +26.38%
Opinions (Top 5)
Code Name Date Action
DTC DATATEC 2026-10-21 View

21-10-2026   Datatec (DTC) is an international IT and telecommunications company operating in more than fifty countries. It operates in the United States, South America, Europe, Africa, the Middle East, and Asia. Its business is divided into three main divisions - technology distribution through Westcon International, integration and managed services through Logicalis, and consulting and financial services through Datatec Financial Services and Analysys Mason.

The CEO, Jens Montanana, is a 10% shareholder. In its results for the year to 28th February 2026 the company reported revenue up 3,3% (US$) and headline earnings per share (HEPS) up 56,5% (US$). The company said, "AI infrastructure investment is driving demand for our products and services - Resilient trading despite geopolitical impact of conflicts and trade wars".

In a trading statement for the six months to 31st August 2026 the company estimated that HEPS would rise by between 0,5% and 7,3%. Technically, the share although volatile, has been recovering since September 2024. It was added to the Winning Shares List (WSL) on 26th October 2024 at 3950c and it has subsequently rose to 9958c on 29th June 2026.

It fell back after the special dividend on 14-10-26 and then resumed its upward trend. We believe it will continue to perform, especially as the use of artificial intelligence (AI) becomes more widespread. 

AGL ANGLO 2026-10-21 View

With Anglo American (AGL), the risk normally associated with commodity stocks is mitigated in two ways. Firstly, the company has diversity of different minerals which reduces the impact of any one mineral entering a bear trend. Secondly, the traditional mechanism to avoid risk is to have a very strong balance sheet with plenty of headroom.

That way, if things turn bad, you can ride out the storm. Anglo has such a balance sheet. Anglo describes itself as a globally diversified mining company with a portfolio of world-class mining operations and undeveloped resources. One of the factors holding the company back has been the poor availability of Transnet’s rail service, especially at Kumba.

Its restructuring will leave it with Kumba and its manganese interest in South Africa. In its results for the year to 31st December 2025 the company reported revenue up 5% and earnings per share (EPS) down 28%. The company said, "Strong production and cost performance from continuing operations, delivering: Underlying EBITDA* of $6.4 billion (2024: $6.3 billion) and EBITDA margins* of 49% in Copper and 43% in Premium Iron Ore." On 10th September 2025 the Business Day reported that Anglo had merged with the Canadian copper miner Teck.

Anglo will own 62,4% of the merged company. Anglo shareholders will get a dividend of $4.5bn as part of the deal. The news pushed Anglo shares up by 9% on the day. In a production update for the 3 months to 30th June 2026 the company reported copper production up 2%, iron ore up 1% and manganese ore up 20%.

The company said, "Rough diamond production increased by 88% to 7.8 million carats, primarily driven by extended maintenance at Orapa which affected the comparative quarter and planned higher-grade ore at both Jwaneng and Gahcho Kue." In an update on the 3 months to 30th September 2026 the company reported copper production down 5% and iron ore down by 4%. Manganese production was up 6%, diamonds decreased by 11% and nickel was up by 3%.

Technically the share has entered a new strong upward trend since September 2025, probably mainly as a result of the merger with Teck. We expect it to continue performing well, but it remains a volatile commodity play. 

KIO KUMBA-IO 2026-10-21 View

21-10-2026   Kumba (KIO) is a highly successful iron mining operation which is owned (79%) and controlled by Anglo American. The share price fell to as little as R223 in March 2020 because of COVID-19 but recovered to R668 before falling on the March 2022 quarterly results. Importantly, exports make up 94% of the company's total sales - which means that it is not heavily dependent on local sales but is vulnerable to any strengthening of the rand and the effectiveness of rail transport to ports.

The company is planning to build a 100mw solar park over the next 3 years to reduce its reliance on Eskom. The company has had to contend with heavy rain and bad rail performance. On 10th October 2022, Kumba announced that, because of the force majeure at Transnet, it would lose about 50 000 tons of production per day, rising to 90 000 tons after 7 days as a direct result of the Transnet force majeure.

Furthermore, they said they would lose about 120 000 tons of exports which will cost them about $8,5m a day in production and $11,7m in lost export revenue. The company is considering 490 retrenchments. In its results for the six months to 30th June 2026 the company reported revenue down 11% and headline earnings per share (HEPS) down 41%.

The company said, "Kumba's first-half performance reflects the impact of a challenging external environment and difficult operating conditions. Despite these headwinds, we delivered EBITDA of R10.9 billion and an EBITDA margin of 35%". In an update for the 3rd quarter to 30th September 2026 the company reported production down 19% and sales up 3%.

The company said, "Iron ore prices remained under pressure as elevated coking coal costs weighed on Chinese steel mill profitability". As at the 20th of October 2026, the share was trading at a multiple of 6,07 and a dividend yield (DY) of 8,32%. This compensates the investor to some extent for the commodity risk in this rand-hedge share, but it remains volatile and hence risky.

Technically, the share has been in a downward trend since July 2021 so we recommend waiting for a break above its long-term downward trendline before investigating further. 

DRD DRDGOLD 2026-10-21 View

20/10/2026   DRDGOLD (DRD) was listed in 1895 and is the JSE's oldest listed company. It was followed by SA Breweries which was listed in 1897 and has now been acquired by Anheuser Busch. DRD is now a gold surface treatment operation which is at an all-in sustaining cost of extraction of just over R627247 per kilogram which compares to the average received gold price of R917996.

They are re-treating surface dumps which still have traces of gold that can be profitably extracted with modern extraction methods. The benefit of this type of operation is that it is far less risky than underground gold mining operations because it has far less union exposure and has none of the expenses or difficulties of an underground operation.

Its life and grade, and hence its profitability, are precisely known. The share tends to be volatile because it depends on the current price of gold, but the company has a debt-free balance sheet and strong free cash flows. A deal was concluded for Sibanye to swap out its surface dumps for an additional 265m DRD shares - which took Sibanye to a shareholding of 38%.

Then on 10th January 2020, Sibanye announced that it had exercised its option to increase its stake to 50,1% at a cost of R1086m. The CEO of DRD Gold, Niel Pretorius, wants to join up with other tailing projects on the West Rand to create a massive unified re-processing operation.

The company is building a 20mw solar and battery facility. In its results for the year to 30th June 2026 the company reported revenue up 42% and headline earnings per share (HEPS) up 89%. The company said, "Group gold production exceeded the upper end of guidance by more than 5 500 ounces and, combined with disciplined cost control and continued strength in the gold price, generated robust cash flows and an excellent financial performance".

In an update on the 3 months to 30th September 2026 the company reported gold production up 2% and the average price per kilogram down 6%. Operating costs were up 9% while all-in sustianing costs rose by 7%. The company was debt free. Technically, the share made a high of 2458c on 9th May 2023 and then began a downward trend.

It broke up through its long-term downward trendline on 3rd July 2024 at 1673c indicating a new upward trend. That upward trend accelerated with the rise in the US dollar price of gold to above $5000 per ounce, but had fallen back with the current correction in the gold price. A new upward trend appears to be beginning from August 2026.

It remains a volatile commodity share subject to the international gold price.

OAS OASIS 2026-10-21 View

Oasis (OAS) is a property company that manages various properties applying the principles of Islamic finance. It also manages institutional investments and retirement portfolios for governments, parastatals, collective investment schemes and private individuals. It has a number of wholly owned subsidiaries that engage in insurance, fund management and property management.

In its results for the six months to 30th September 2026 the company reported total income down 1,6% and headline earnings per unit down by 16,8%. The company said, "OCPF has no debt and its tenant profile remains low-risk as 86% of tenants are multi-national, national, or government-related". The company's net asset value (NAV) increased by 2,3% to 2884c per unit.  There are many days where the share price does not move and average daily volumes are below R10000.

This makes it impractical for private investors.

Winning Share: SBK
Opinion: KIO
October Month  (2026-10-19)

There are generally two types of risk in the share market – the risk that a specific share which you have bought falls known as unsystematic risk, and then the risk that the market as a whole falls and drags all your shares down with it - known as systematic risk. The systematic risk that the market…

There are generally two types of risk in the share market – the risk that a specific share which you have bought falls known as unsystematic risk, and then the risk that the market as a whole falls and drags all your shares down with it - known as systematic risk. The systematic risk that the market is in or about to enter a bear trend is obviously a vital consideration for the private investor. During a bear trend about 80% (or more) of shares will fall while only 20% will rise. This means that from a purely statistical point of view it is better for private investors to stay out of the market during bear trends.

It is also very important to be able to distinguish between a correction (which is often a buying opportunity) and a bear trend. The safest approach is always to always buy shares which are rising, in sectors which are rising in a market which is rising. At the same time keeping a strict stop-loss strategy is vital to protect the bulk of your capital. As a private investor you should have an absolute rule that you never lose more than 15% on any share market investment – ever – and that should include your dealing costs. This can only be achieved if you buy free-dealing shares and always adhere to a strict stop-loss strategy.

Today, Monday 19th October 2026 is the exact anniversary of the greatest single day crash in stock market history. Thirty nine years ago, on Monday 19th October 1987, Wall Street collapsed. The S&P500 index fell more than 20% in the day. Other famous bear trends have also begun in October month, including the infamous 1929 crash, the bear trend of the year 2000, the 2008 sub-prime crisis, and the bear trend of 2022 associated with the Ukraine War. So, October month has a bad reputation with investors, and they generally heave a sigh of relief when it is over.

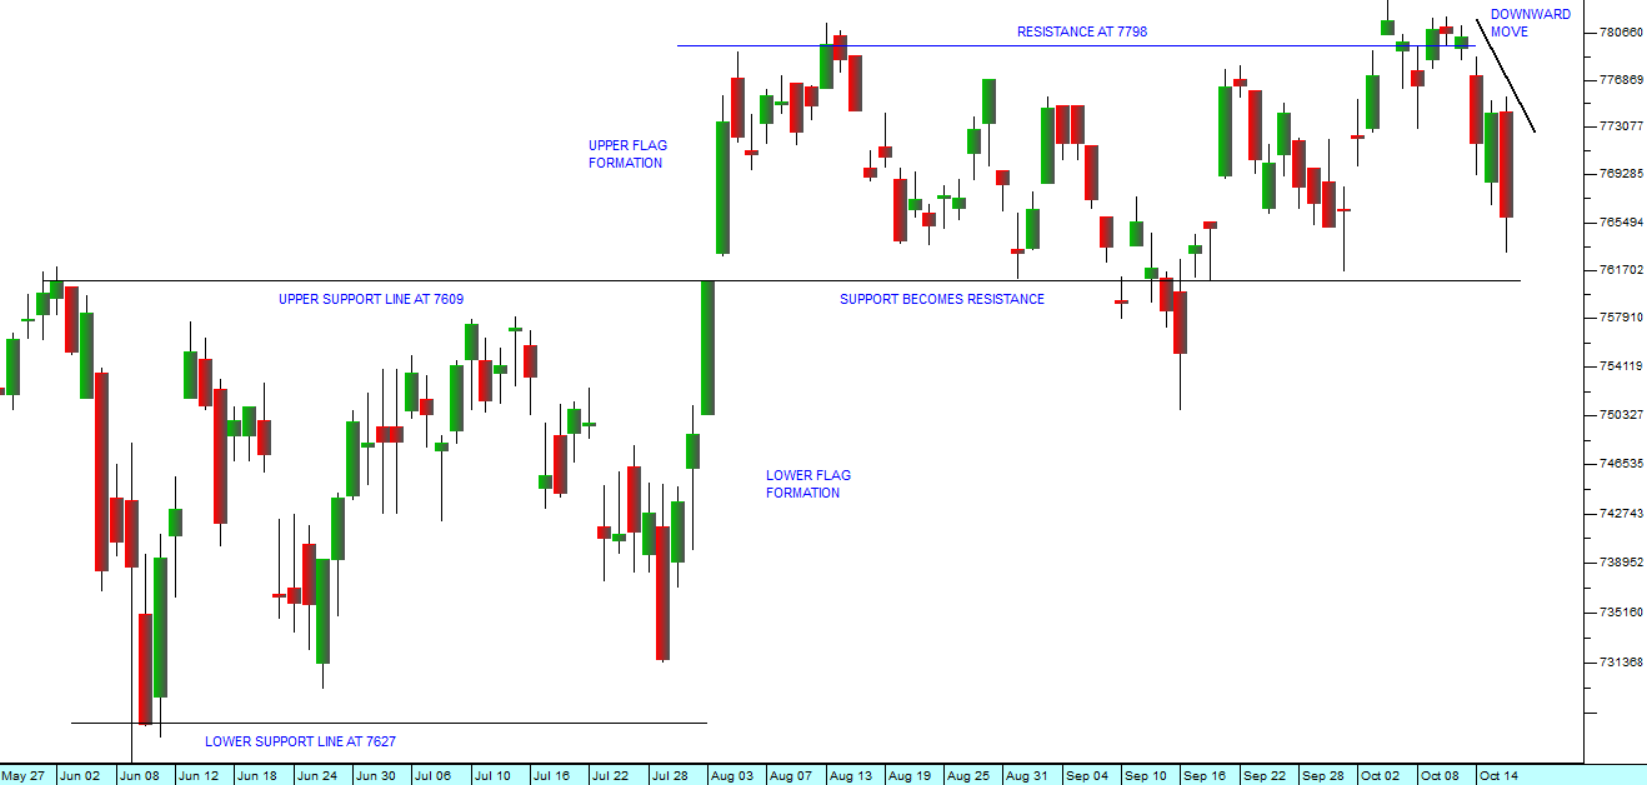
Ominously, Wall Street has been falling over the last week as the Iran war flared up again, pushing the price of North Sea Brent up to nearly $110 per barrel. Consider the chart:

S&P500 Index : 27th of March 2026 - 16th of October 2026. Chart by ShareFriend Pro.

In our analysis, we have drawn your attention to the fact that the S&P500 index has been moving through two sideways markets or flags as the countervailing forces of the rising oil price and the profitability of the artificial intelligence (AI) revolution play out.

The climb in the fuel price is causing a re-evaluation of inflationary risks throughout the world, but especially in America, where the price of petrol has remained stubbornly above $4 per gallon and diesel has hovered above $6 per gallon. With the mid-term elections just weeks away, Republicans and especially Trump are facing a barrage of criticism for their handling of the economy. The Iranians on the other hand are doing everything in their power to keep the oil price at high levels to put the maximum pressure on Trump.

What is notable is that the high oil price appears to be having less and less impact on Wall Street as time goes by. When Trump and Netanyahu began their war with Iran the S&P fell back sharply to 6611 on the 6th of April 2026, and the price of Brent oil went above $110 per barrel. Today Brent is again hovering close to those levels and the S&P has recently managed to reach a new record high at 7818. The world has been facing increased levels of inflation, rising interest rates, and record bond yields - but despite that, AI and corporate profits continue to take the market higher.  

In our opinion, as soon as October month is safely behind us and especially if the mid-term elections have the effect of reducing Trump to a lame dog president, we can look forward to a Christmas rally in the S&P500 during the festive season and into next year. As usual, we strongly advise you to be vigilant and to maintain your stops.

Quantum Computing  (2026-10-12)

We live in an age where advances in technology are driving the gains in productivity and profits, and then being discounted directly into share prices. Artificial intelligence (AI) is already well established and being used by most companies to improve productivity. This can be seen in the results…

We live in an age where advances in technology are driving the gains in productivity and profits, and then being discounted directly into share prices. Artificial intelligence (AI) is already well established and being used by most companies to improve productivity. This can be seen in the results coming out of the companies in the S&P500 index. The impact of AI has only just begun to be discounted and now the next major technological breakthrough, quantum computing, is hovering in the background.

Quantum computing is essentially a jump forward in hardware which allows computers to analyse multiple different solutions simultaneously. Instead of using bits which are either 1 or 0, a quantum computer uses qubits which can exist in multiple states simultaneously - together with quantum entanglement. The technology uses the laws of physics at the atomic and subatomic level to solve complex problems much faster than regular computers, even supercomputers. Microsoft, Google, Amazon, Oracle, and even Meta and Tesla, are rushing to install quantum computing into their infrastructure. In a word, quantum computing will increase the power of AI substantially making it even faster and more powerful than it already is.

With that background, the earnings of S&P companies for the third quarter are beginning to trickle in, with 19 companies having reported so far. Total 3rd quarter earnings for those companies that have reported results already are up +150.9% from the same period last year on the back of revenues which are +27% higher. 79% of those companies are beating EPS estimates and 73.7% are beating revenue estimates.

The average estimate for all S&P500 companies is that earnings will be up by 24,3% in the 3rd quarter when compared with a year ago – and this will be the 8th straight quarter where estimates have been in positive double digits. 15 out of 16 sectors are expected to make significant gains – led by the technology and energy sectors.

As things stand now, the progress of the S&P500 index is being significantly held back by developments in Trump’s Middle East war and the price of oil. Iran would like to hold the price of North Sea Brent above $100 per barrel, at least until after the mid-term elections on 3rd November 2026 – which of course is very bad news for the struggling Republican party and Trump.

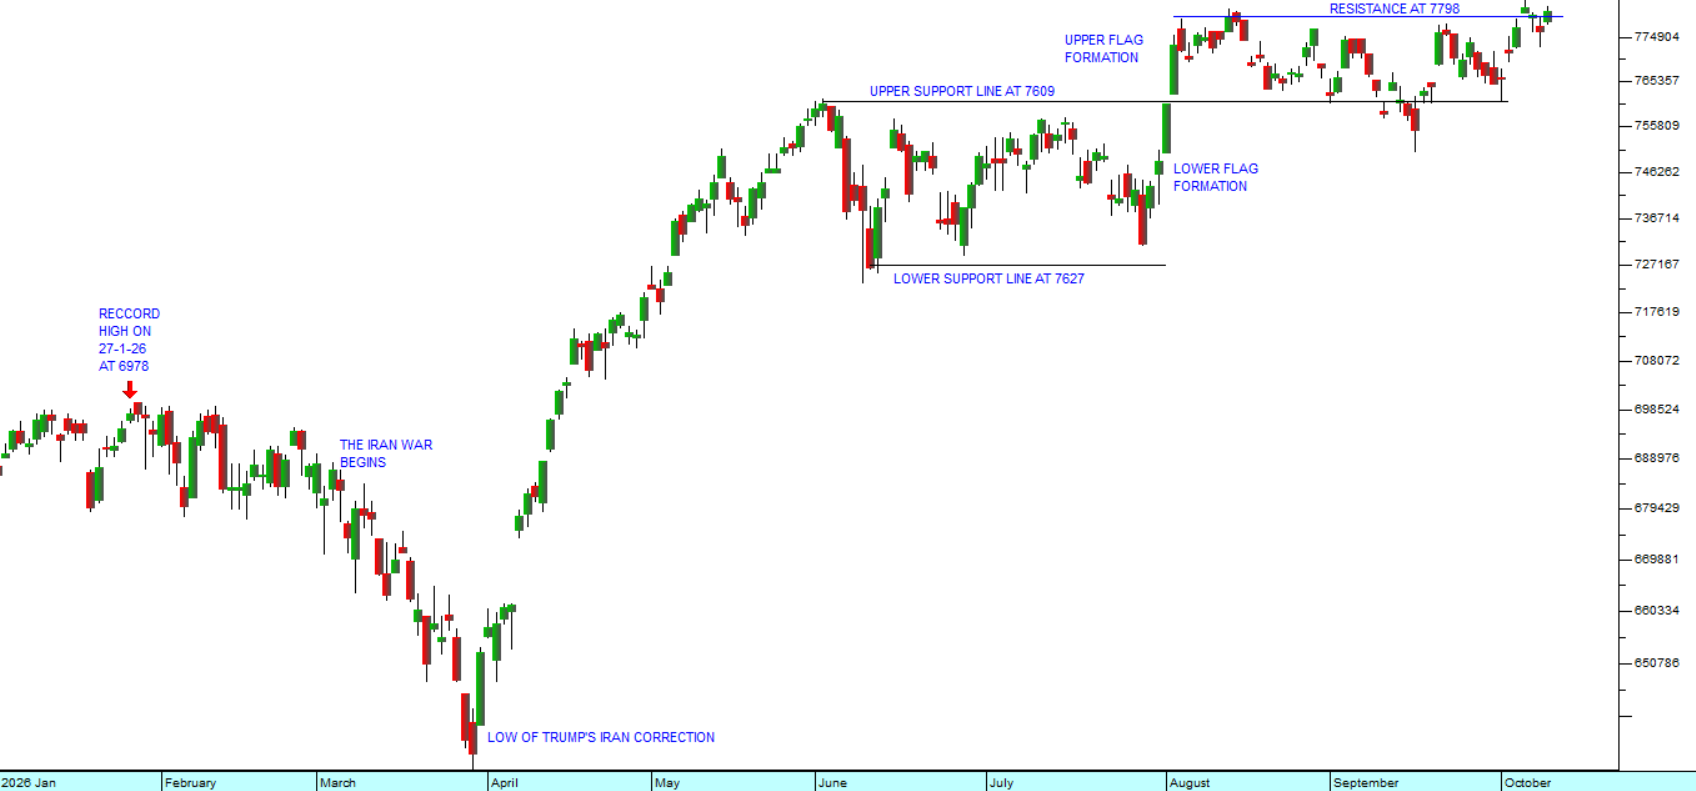
Looking at the chart, the S&P500 index has been moving through a series of protracted sideways markets for the past four months. During that time, technology and the prospects of that technology have not stood still. They have been advancing at a rapid pace.

Our belief is that as soon as the situation in the Middle East is resolved and the oil price comes back to where it was before the war began, the S&P will suddenly begin discounting the impact of the accumulated technical advances and move sharply higher. It will be like removing the lid from a pressure cooker. Consider the chart:

S&P500 Index : January 2026 - 9th of October 2026. Chart by ShareFriend Pro.

So, what we are saying is that considerable bullish potential has been built up by this war and its impact on oil prices. This can be seen from the fact that even with Brent at over $100 a barrel now, the S&P is still making new record highs, based on the exceptional estimates of 3rd quarter earnings and beyond.

There are, of course, those who believe that Brent is about to go much higher – like to $125 per barrel - given the escalation in Yemen with the Houthis and the attacks on the Saudi pipeline. But in our view the underlying direction of the oil price must be downwards as the world moves away from fossil fuels and towards renewables, especially solar.

To be safe, ensure that you have a strict stop-loss level for all the shares in your portfolio. That is the ultimate protection against unexpected downtrends and bear markets. Your absolute rule should be to never lose more than 15% on any share market investment ever – including your dealing costs. Sometimes it is difficult to achieve this, but provided you always choose shares which are free-dealing, it simply becomes a matter of self-discipline. And then if you are able to make several hundred percent on your winners, mathematically, you must be successful over time.


The Omnia Takeover  (2026-09-28)

Omnia is a manufacturer of chemicals used in agriculture (fertilisers), mining (explosives) and various industries. It operates primarily in South Africa, but its products are sold throughout Southern Africa and abroad. In its latest financial statements for the year to 31st March 2026 the company…

Omnia is a manufacturer of chemicals used in agriculture (fertilisers), mining (explosives) and various industries. It operates primarily in South Africa, but its products are sold throughout Southern Africa and abroad.

In its latest financial statements for the year to 31st March 2026 the company reported revenue up 6% and headline earnings per share (HEPS) up 21%. The company benefited in some ways from the war in Iran and the closure of the Strait of Hormuz because that restricted the flow of agricultural chemicals onto world markets resulting in higher prices. Omnia was able to pay a dividend of 470c for the year, plus a special dividend of 280c. During the year it also bought back and cancelled 187436 of its own shares at an average price of 6465c per share returning a further R12,1m to shareholders.

This is one of the companies that was very hard hit by the COVID-19 pandemic, and its share price fell to a low of 1536c in May 2020. We published an article about it on 2nd September 2019, drawing attention to the fact that it had been consistently trading well below its net asset value (NAV) for some time. Obviously, when a profitable listed company trades below its NAV, it generally becomes a potential take-over target for both local and international investors.

For the next five years Omnia continued to strengthen and diversify its position. By March this year it was growing profits in all divisions and had a strong balance sheet. This attracted the attention of a large international chemicals company operating out of India, The Solar Group, who have now made an offer to buy 100% of Omnia’s ordinary shares for 13450c each. Omnia will delist from the JSE once the acquisition scheme by Solar SA Investments is implemented.

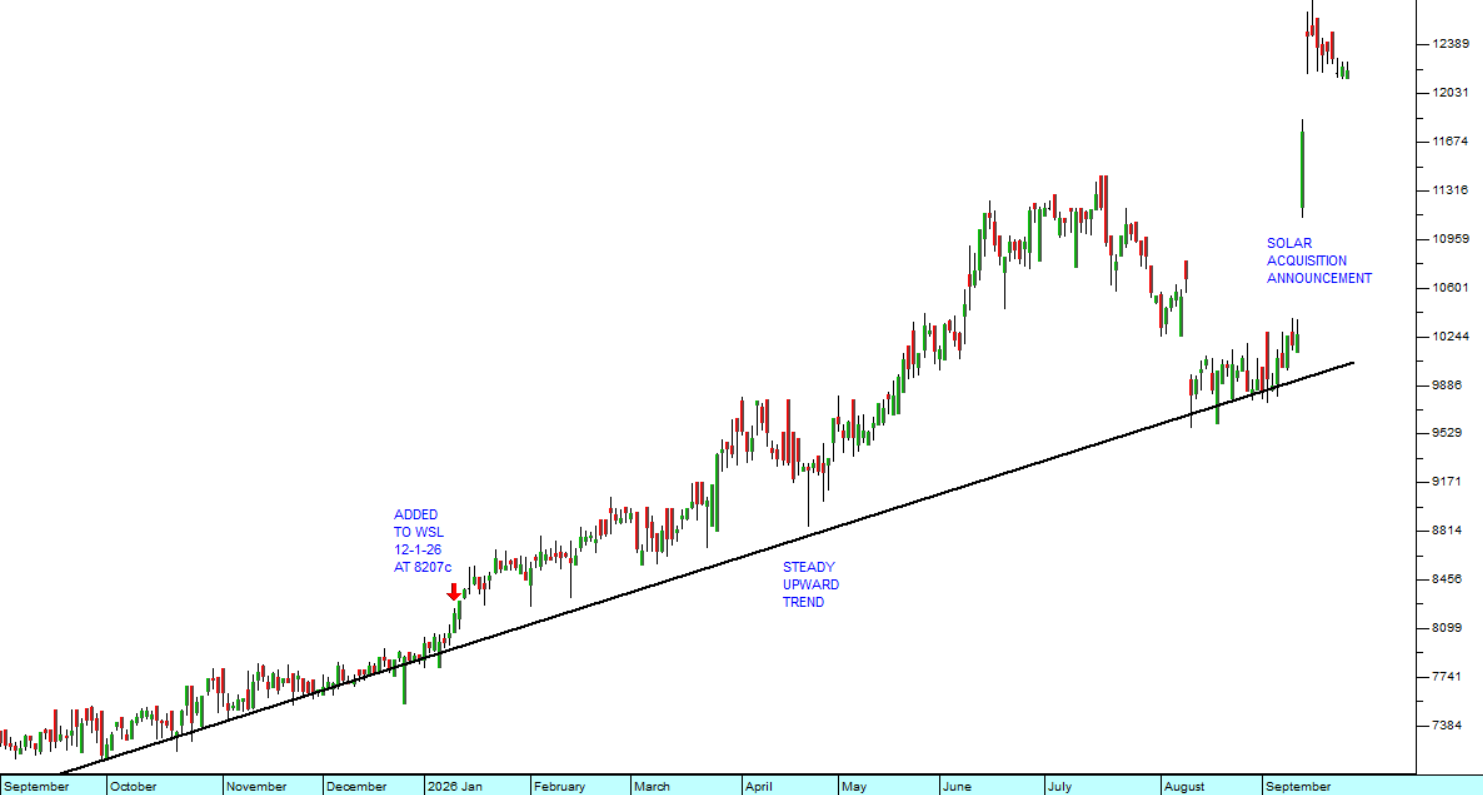
The cautionary announcement was published on the Stock Exchange News Service (SENS) on 11th September this year and the share price immediately rose sharply in response. The fact that it did not rise earlier indicates that there was little or no insider trading associated with this announcement. Consider the chart:

Omnia (OMN) : September 2025 - 25th of September 2026. Chart by ShareFriend Pro.

In anticipation of good results at the year-end in March 2026, we added Omnia to the Winning Shares List (WSL) on 12th January 2026 at a price of 8207c per share. At the time we felt that the company was trading well below its value given its track record and performance.

The Solar Group sells its products in 90 countries around the world and has manufacturing facilities in 11 countries. There are considerable synergies flowing from the acquisition, especially considering that Solar does not appear to be in agricultural sector. Omnia’s expertise and product knowledge will add considerably to the group over time.

Taking into account that an investor would have received 750c in dividends, the decision to buy into Omnia when we added it to the WSL would have yielded a return of 13450c + 750c – 8207c = 5993c or 73% in a period of much less than a year. Altogether a very satisfactory investment!

JSE Top 40

102,553.00 (+1.27%)

All Share

110,399.00 (+1.29%)

Financial 15

25,508.00 (+1.94%)

J200
J203
J212
Top Gainers
# Code Name Close (c) % move
1 GML GEMFIELDS 78 +14.71%
2 WVR WEAVER 5296 +12.68%
3 CHP CHOPPIES 89 +11.25%
Top Losers
# Code Name Close (c) % move
1 ISB INSIMBI 56 -30.00%
2 MCZ MC-MINING 252 -10.00%
3 AME AME 6000 -9.52%

Top Movers – Charts

Top Gainer: GML
Top Loser: ISB