New Record on the S&P
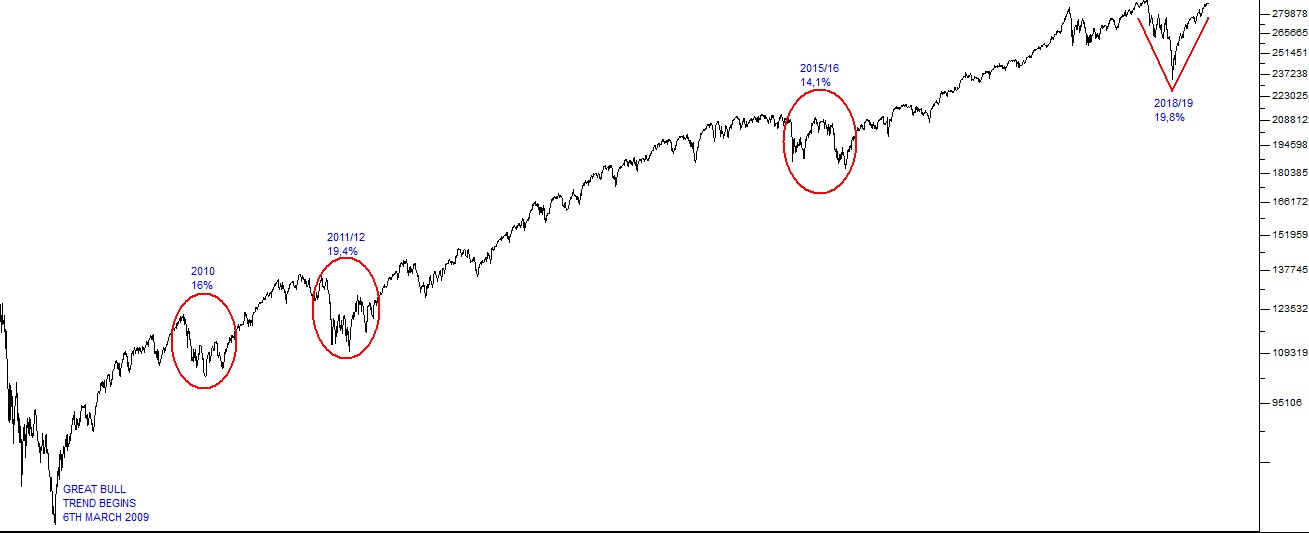
24 April 2019 By PDSNETSeven months ago on 20th September 2019, the S&P made a new record high at 2930 – and from that level began a correction. Corrections are completely normal and even healthy events which occur regularly during the course of a bull trend. This ten-year bull trend began on 6th and 7th of March 2009 when the S&P made an intra-day low of 666.79 on 6th and then made its lowest close at 676.53 on 7th. The fall in the market had been caused by an American banking crisis which later became known as the “sub-prime crisis" when Lehman Brothers collapsed. What followed was an inordinate monetary policy stimulation of the world economy during which more than $12 trillion worth of quantitative easing (QE) was done to try to avoid a repeat of the Great Depression of 1929. Ten years later we can say that the QE was successful and the world economy has eventually turned around – but not without some very scary moments such as the Greek crisis during which it looked as though the entire European Union was in danger. Last night’s close on the S&P at 2933 signals the end of the 4th major correction in the bull trend. These were:
- An 8-month correction in 2010 of 16%.
- A 10-month correction in 2011/12 of 19,4%
- A 13-month correction in 2015/16 of 14,1%
- A 7-month correction in 2018/19 of 19,8%

S&P500 Index 2009 to 2019 - Chart by ShareFriend Pro (Click to Enlarge Image)
The most recent correction was both the shortest and the deepest of these corrections – more like a “V bottom" - and much of it was caused by Donald Trump’s rhetoric over the Christmas period when very few investors were active in the market. We never had any doubt that it was a correction and not the start of a new bear trend – mainly because the US economy, which is the engine that ultimately drives the stock market, was performing so well. Indeed, last night’s surge on Wall Street came about because of a slew of above-expectation results from S&P500 companies. Coca Cola and United Technologies reported better-than-expected results while Twitter shares jumped over 15% on their results as they added 330 million new active users. Lockheed Martin and Procter & Gamble also beat expectations. Altogether, so far, 78% of the more than 140 S&P500 companies that have reported have beaten expectations. The only real negative is the oil price which has been trending up steadily. Of course, there is the outside possibility that what we are seeing is a “double top†on the S&P, but as we have been saying right through this correction, we believe that what we are looking at is a solid resumption of the great bull market which began 2009. JSE shares are following Wall Street up and should continue to do so.DISCLAIMER
All information and data contained within the PDSnet Articles is for informational purposes only. PDSnet makes no representations as to the accuracy, completeness, suitability, or validity, of any information, and shall not be liable for any errors, omissions, or any losses, injuries, or damages arising from its display or use. Information in the PDSnet Articles are based on the author’s opinion and experience and should not be considered professional financial investment advice. The ideas and strategies should never be used without first assessing your own personal and financial situation, or without consulting a financial professional. Thoughts and opinions will also change from time to time as more information is accumulated. PDSnet reserves the right to delete any comment or opinion for any reason.
Share this article:
