Inflation
7 March 2022 By PDSNETThere can be little doubt now that inflation world-wide is gaining momentum. America recorded 7,5% in January 2022 and Europe had inflation of 5,1% in January 2022 which is expected to rise to 5,8% in February. If that happens it will the first time for many decades that I can recall inflation being higher in both Europe and America than it is here in South Africa.
The primary cause of this inflation is the rising oil price. This has caused petrol prices to jump. For example, in Germany the petrol price reached a record of 1.72 euros per liter (R28.76). North Sea Brent oil has been rising sharply in recent weeks as a result of the conflict in Ukraine. Consider the chart:
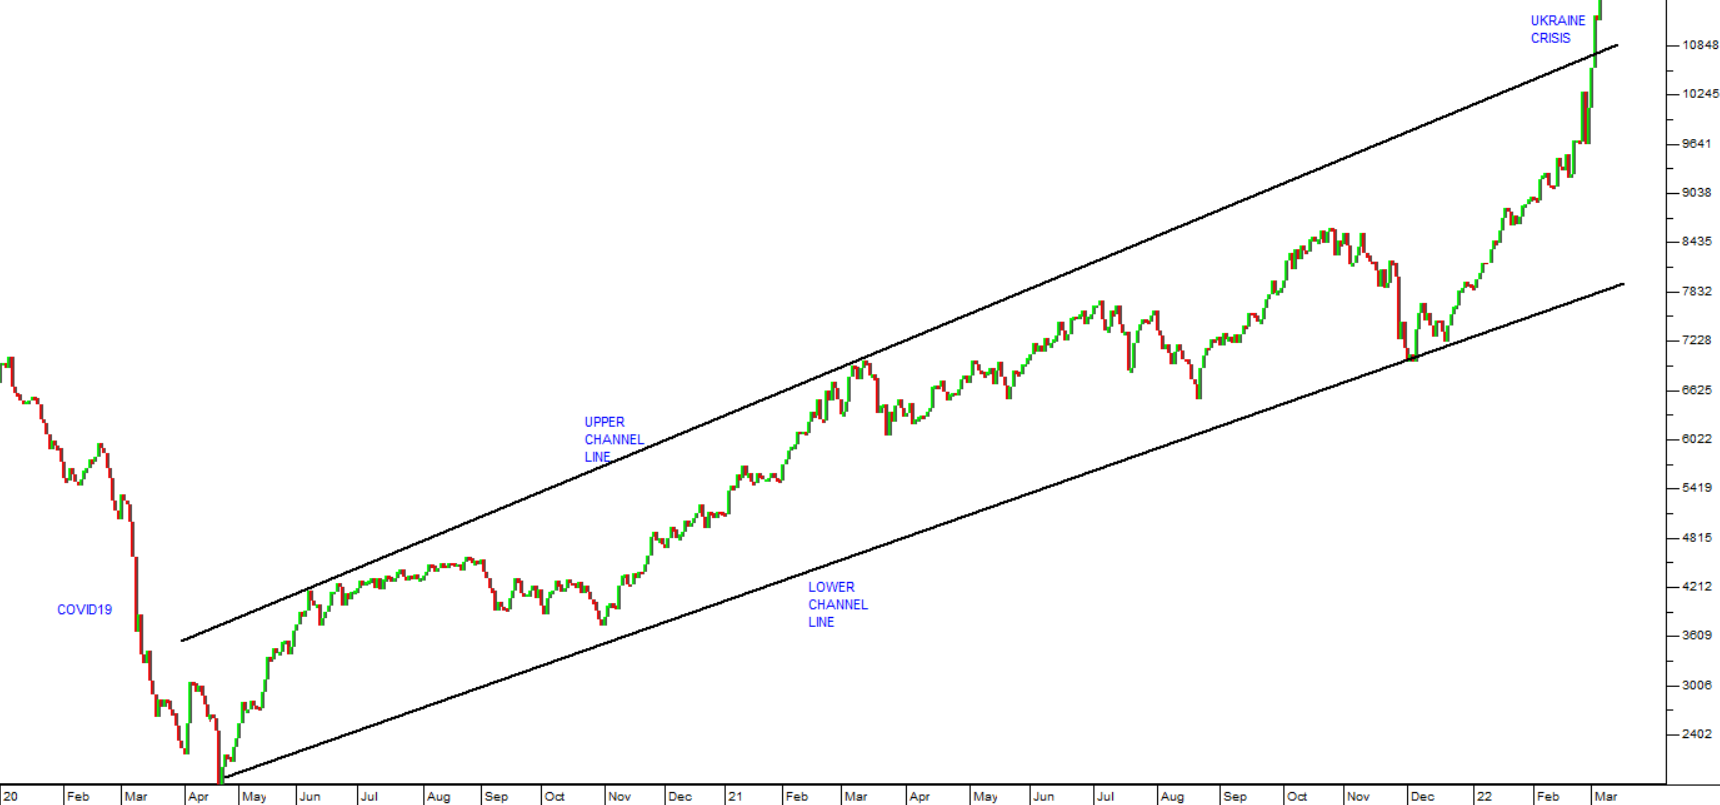
Here you can see that Brent had been rising since the spike downwards caused by COVID-19 in April/May 2020. That increase has been taking place between rising channel lines, but on Friday last week the price broke the upper channel line to reach a new cycle high of $114.51 – the highest price since September 2013.
Higher inflation means falling quantitative easing (Q/E) and rising interest rates as central banks desperately try to put the “genie back into the bottle”. Central banks postponed tightening interest rates and increased Q/E to counter the effects of COVID-19 and the lockdowns. Now, just as they were contemplating normalizing the level of rates and moving away from Q/E, the Ukraine crisis has materialized.
The Ukraine situation is very fluid, because it depends on the emotional responses of Putin who has apparently badly miscalculated the realities on the ground and appears to be intent on restoring the original boundaries of the USSR. How far will he go? Is he willing to escalate the situation in the face of increasing pressure both at home and abroad? Would he initiate a nuclear war to save face if he finds himself backed into a corner? And exactly how will the various monetary policy committees (MPC) of the world adjust interest rates now to reflect what is rapidly becoming the “new normal” in Central Europe?
As a private investor, these questions are almost impossible to answer with any degree of certainty. We simply do not have enough information. In a situation like this it is best to rely on what the S&P500 chart is telling us. After all, the S&P discounts the understanding and decisions of the wealthiest people in the world who are the best informed and have the most to lose if they are wrong. To date, its predictions have been the most accurate and perspicacious. Consider the chart:
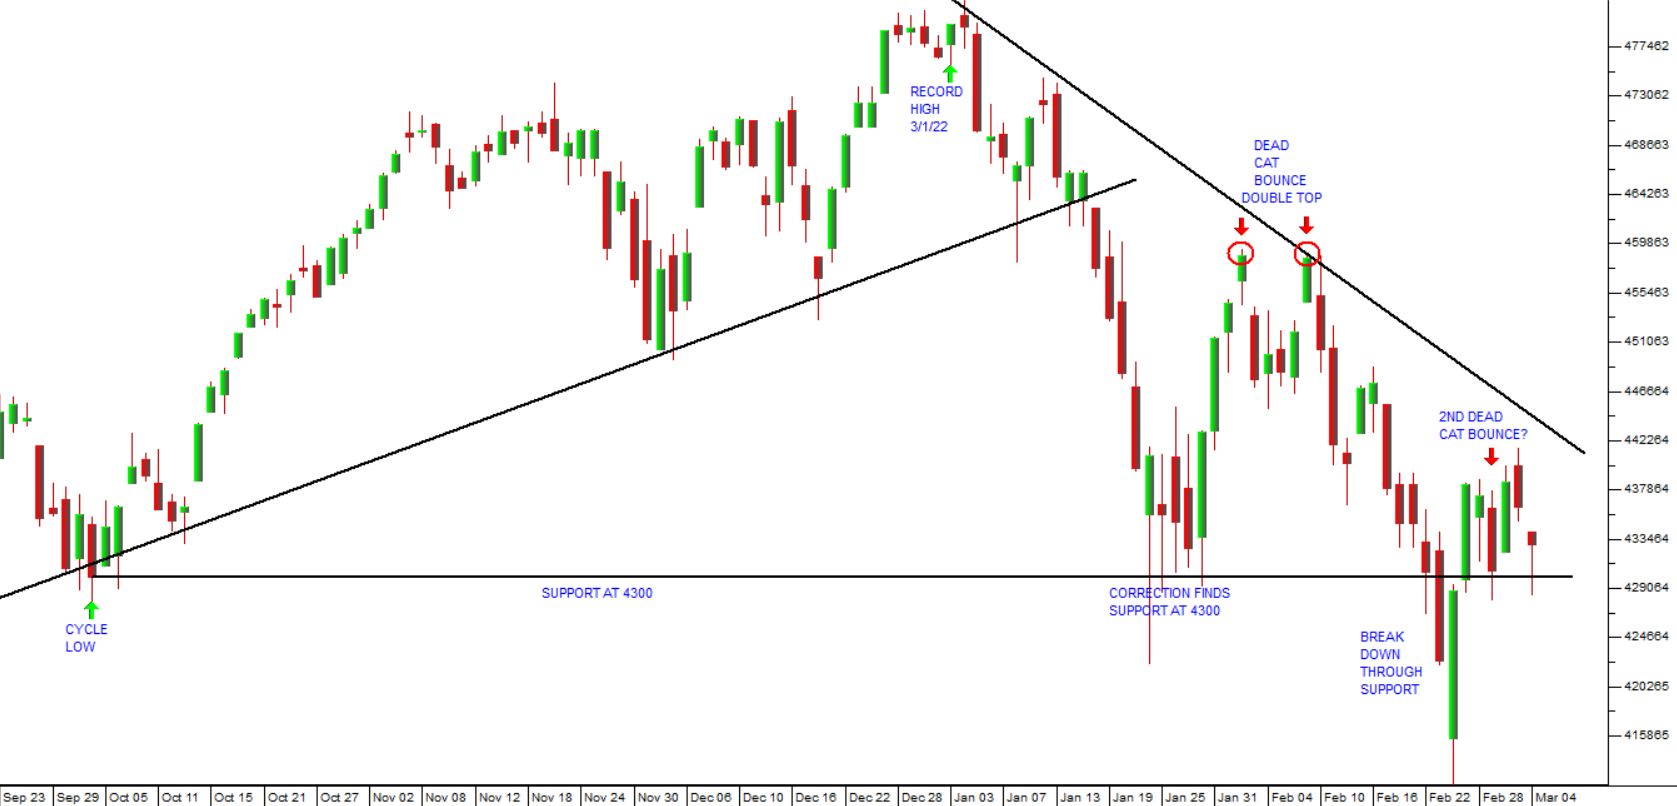
Firstly, experience told us as far back as November 2021 that a major correction of between 10% and 20% was on its way and, indeed, overdue. Then when that correction began in January, it became possible to estimate its probable extent by subtracting 10% to 20% from the record high of 4796 made on 3rd January 2022. That suggested that the index would fall to between 4316 (90% of 4796) and 3836 (80% of 4796).
Following that, it was apparent that the initial downward move to the support at 4300 (established by the cycle low on 4th October 2021) had been insufficient to meet the criteria for a major correction. It became clear that the rally in late January and early February was a “dead cat bounce”. Without knowing about the Ukraine crisis, we were able to predict that the market would fall further and break below the 4300 support level – which, of course, it did on 23rd and 24th February 2022.
Since then, we have had another rally which we believe will probably turn out to be a second “dead cat bounce”. Again, we reiterate that the S&P needs to find a low point somewhere in the area below 4300, probably closer to 4000, but not below 3836 before this correction is over.
What is slowing the process down and to some extent obscuring the pattern is the excessive bullishness in the market. This has been evident in the intra-day market action and the unusual enthusiasm of the bulls in “buying the dips”. But the chart does not lie. What we are looking at is a downward trend which is not yet over. The fact that the support level at 4300 was broken, however briefly, indicates to us that there is further downside potential. The bullishness that we have observed in both dead cat bounces tells us various things:
- The recovery when it comes is likely to be very sharp.
- The fall is likely to be somewhere around 4000 rather than the potential low of 3836.
- This is definitely a correction and not the start of a new bear trend.
This analysis might appear to be a bit abstruse and devoid of factual foundations, but we have found over our decades of watching the markets that with highly complex international developments (like rising world inflation and Ukraine), the systematic pattern can best be understood and anticipated in this way. The fundamentals literally appear unexpectedly to justify and rationalize what the charts had been telling you all along.
So, our expectation is that the news flow will become worse before it gets better. In the coming weeks and months, incidents like the bombing of the nuclear power plant in Ukraine will take the market down (reluctantly because of the excessive bullishness) to lower levels somewhere around 4000 on the S&P. Then at those lower levels the news flow will begin to improve at a certain point (perhaps because of a negotiated settlement) and a sharp recovery will take place.
What is clear (and apparent from the excessive bullishness in the market) is that nobody believes that this correction is, in fact, the start of a new bear trend. It is a correction which will play itself out within defined parameters - and when it is over the S&P500 will recover very rapidly and make a new record high – probably before the end of this year.
DISCLAIMER
All information and data contained within the PDSnet Articles is for informational purposes only. PDSnet makes no representations as to the accuracy, completeness, suitability, or validity, of any information, and shall not be liable for any errors, omissions, or any losses, injuries, or damages arising from its display or use. Information in the PDSnet Articles are based on the author’s opinion and experience and should not be considered professional financial investment advice. The ideas and strategies should never be used without first assessing your own personal and financial situation, or without consulting a financial professional. Thoughts and opinions will also change from time to time as more information is accumulated. PDSnet reserves the right to delete any comment or opinion for any reason.
Share this article:
