Shoprite
15 April 2024 By PDSNETIn their article on 10th April 2024, Checkers sweeps Pick n Pay as it opens 5 new stores in one day., Businesstech drew attention to the fact that Shoprite had taken over five stores from Pick ‘n Pay on the East Rand. Pick ‘n Pay got into a legal battle with its franchisee over unpaid debts and the franchisee made a deal with Shoprite, the owner of Checkers. The thrust of the article was that Shoprite was continuing to take significant market share away from Pick ‘n Pay.
Of course, Shoprite has been doing very well for many years in its competition with other supermarkets, but the question private investors have to ask is:
“Is it a good investment?”
You will probably have noticed that the Shoprite share price has been falling during 2024, despite its excellent results. Consider the chart:
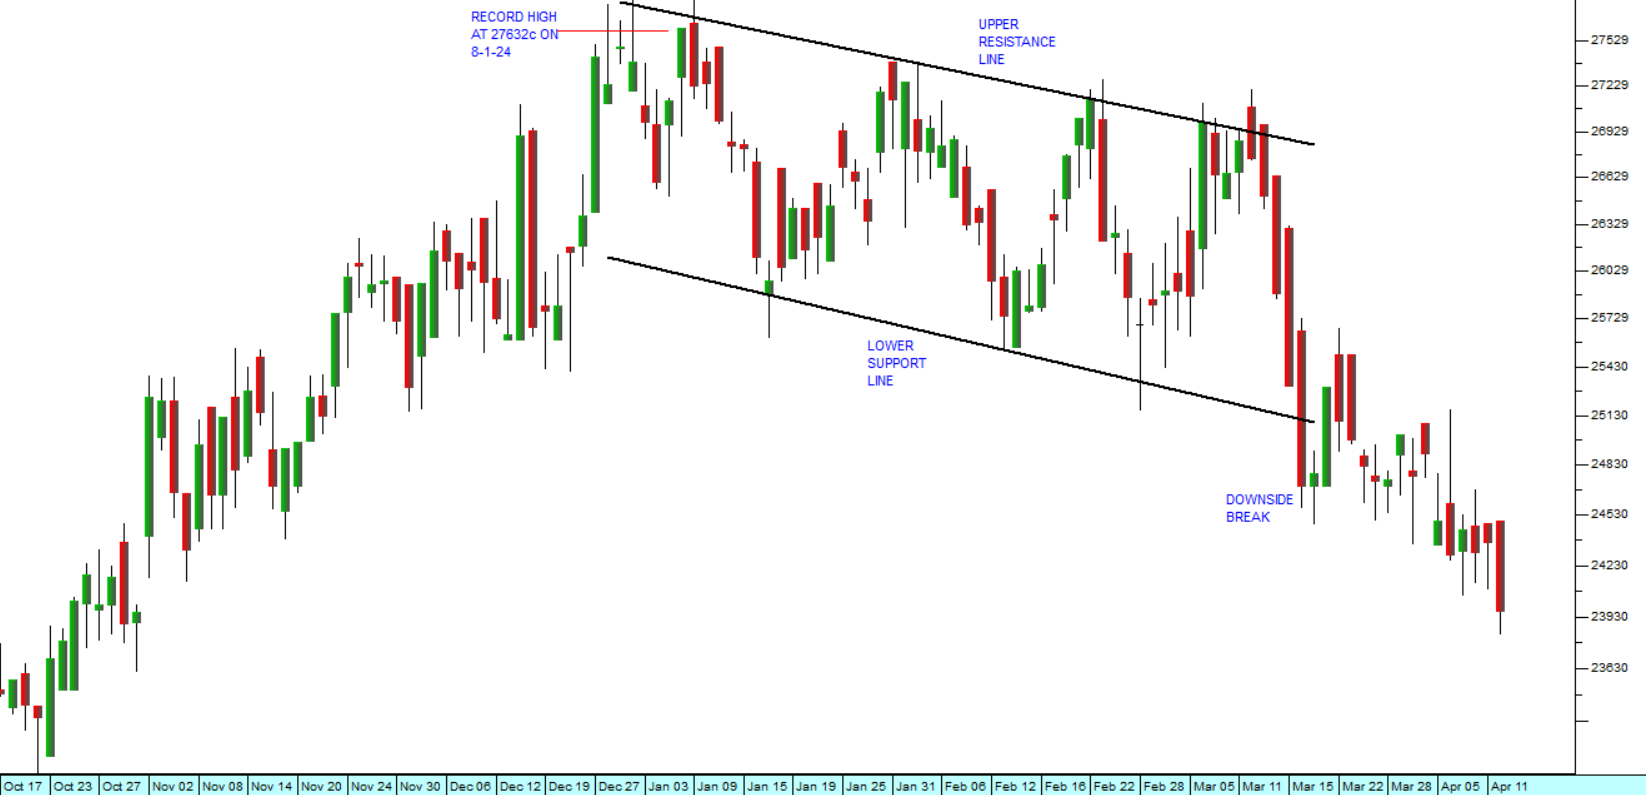
Here you can see that the share closed at an all-time record high at 27632c on 8th January 2024. After that it has been in a downward channel between upper and lower support lines until it broke down on 18th March 2024 and has been falling further since then.
As a private investor you might find it difficult to understand why a company which is doing so well has a share price which is falling. The reason is that investors had simply pushed the share price too high. On the day that it made that record high it had a P:E of 25,23 – which is very high for a grocery retailer, no matter how well it is doing. For context, on 8th January 2024, the JSE Overall index had an average P:E of around 10,5 – so Shoprite was trading at more than twice the market’s average.
A key component of a share’s value at any given price is the nature of is business. Some businesses are very easy to manage while others are very difficult. On the scale from easiest to most difficult, retail grocery chains, like Shoprite, are not the most difficult, but they are certainly among the most difficult.
This is because they have huge working capital requirements, a substantial capital investment, a large usually unionised staff complement and paper-thin margins. These characteristics make it very difficult to manage a supermarket chain and make profits.
Even Shoprite with its enormous footprint made a trading profit of R6,67bn in the six months to 31st December 2024 – which is just 5,9% of its merchandise sales for the same period. Their headline profit was even smaller at 3%. So, if they sell R100 worth of groceries, they are making just R3 profit on that.
You should compare this to a service business which typically has almost no working capital, relatively few high-quality staff and very high margins. A business like Multichoice (MCG), for example, receives debit orders from its 21,7 million subscribers every month.
Their overheads are probably covered before the month starts. Roughly speaking, Shoprite only covers its costs and makes a profit on the last day of the month. So, at its current P:E of 21,3, despite its excellent performance, Shoprite is probably still over-priced and has the potential to fall further.
Almost 33 years ago on 17th October 1991, Shoprite shares closed at 64c. On Friday last week, they closed at 23956c – and that was after falling 13,3% from their record high of 27632c. Throughout that 33 years the company has paid regular dividends. Last year’s dividend was 663c per share.
At some point the institutional fund managers will begin to buy them again and the share will begin to go up. The question is, “Exactly when?” and there is no good way to answer it. You could, of course, take the attitude that Shoprite is a good long-term investment and simply accumulate it on weakness.
DISCLAIMER
All information and data contained within the PDSnet Articles is for informational purposes only. PDSnet makes no representations as to the accuracy, completeness, suitability, or validity, of any information, and shall not be liable for any errors, omissions, or any losses, injuries, or damages arising from its display or use. Information in the PDSnet Articles are based on the author’s opinion and experience and should not be considered professional financial investment advice. The ideas and strategies should never be used without first assessing your own personal and financial situation, or without consulting a financial professional. Thoughts and opinions will also change from time to time as more information is accumulated. PDSnet reserves the right to delete any comment or opinion for any reason.
Share this article:
