RECTANGLE
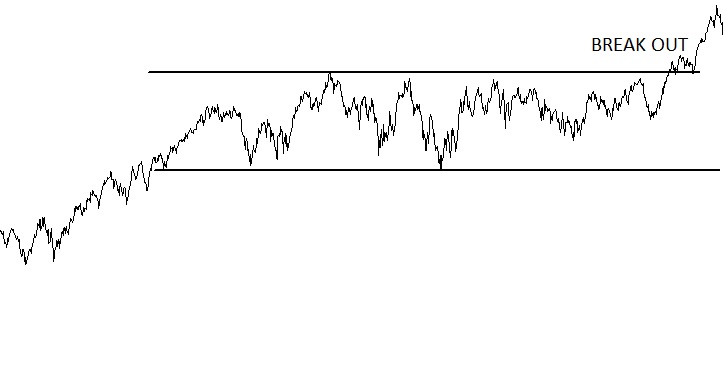
25 May 2016 By PDSNETA charting formation in which a share's (or any security) price is bound between two horizontal lines. The upper horizontal line represents resistance at that price level. The bottom horizontal line represents support at that price level. A breakout on the upper resistance line would provide a clear buy signal. Likewise, a breakout on the lower support line would indicate that a downtrend will occur and it's best to sell.
Share this glossary term: