Why Technical Analysis is Vital
9 January 2018 By PDSNET
For this reason, it is essential for investors to watch the daily market action in such shares very closely – because somebody always does know what is going on - and inevitably they will use that knowledge to trade and make a profit. Their trades cannot be hidden from you. They will always be clearly visible in the price and volume patterns in the share – if you know what to look for.
Let us consider the technical early warning signs of trouble at EOH and Steinhof
The big story at the end of 2017 was the sudden and unexpected collapse of Steinhof. Of course, prior to the sudden collapse from R55, the share had been falling steadily affording everyone an opportunity to get out on stop-loss. The Christo Wiese flagship, in which he personally was a major shareholder, appears to have been involved in some “accounting irregularities” – usually a euphemism for fraud. Marcus Jooste seems to be at the heart of these “irregularities” but, so far, no details have emerged. Wiese himself has taken charge in an effort to re-establish investor confidence – and undoubtedly the truth will come out over the next few months. As a private investor it is impossible to find out exactly what is going on – and clearly many institutional investors are also in the dark. The share has fallen to about 10% of what it was trading for a month ago – but it did seem to find some stability at around 465c and made an “island” at that level. The question is, “Should you take the risk of buying in at current prices when the NAV is quoted at R57 – but is probably not more than half of that?” Can you take the chance that, say, half of that NAV is still there? It is very difficult to know, but in our view it is unlikely that Steinhof will fall much further than 465c and you always have your stop-loss strategy to fall back on.
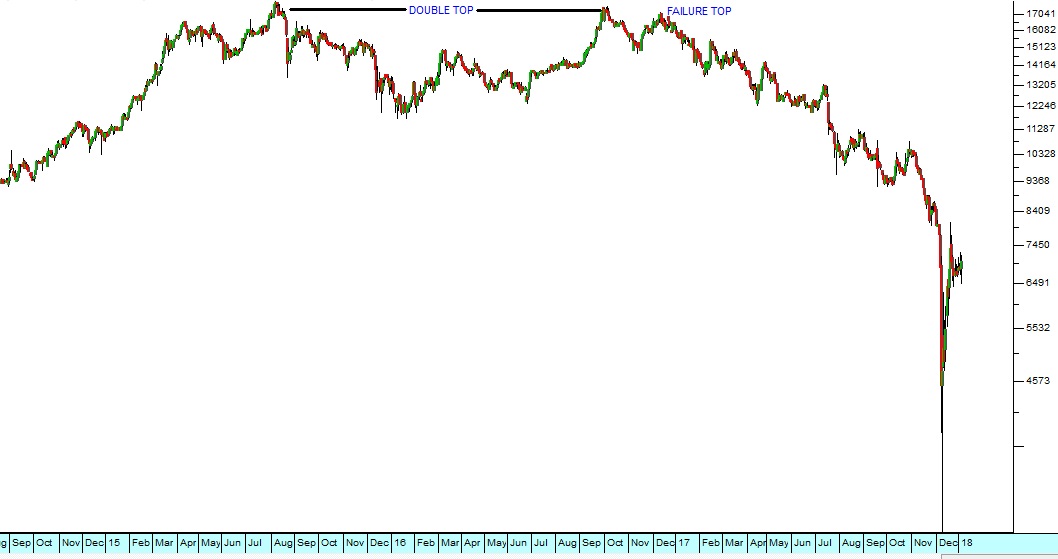
Another startling collapse of a blue chip share, similar to Steinhof, was EOH. Both these highly regarded shares had been falling for some time and then experienced a sudden unexpected collapse. EOH made a very convincing “double top” with peaks at R178 on 6th August 2015 and then at R175 or 3rd October 2016. The failure top in December 2016 showed that the share was unable to break above the previous two highs and this was a fatal sign. Any investor holding these shares should have sold out then.
Consider the chart: