Steinhoff Breaks Up At Last
13 July 2018 By PDSNETWhen a blue chip, institutional share like Steinhoff falls heavily, there are always private investors looking to buy it at its much reduced price hoping to make a quick profit. But there is great danger in taking a position too early.
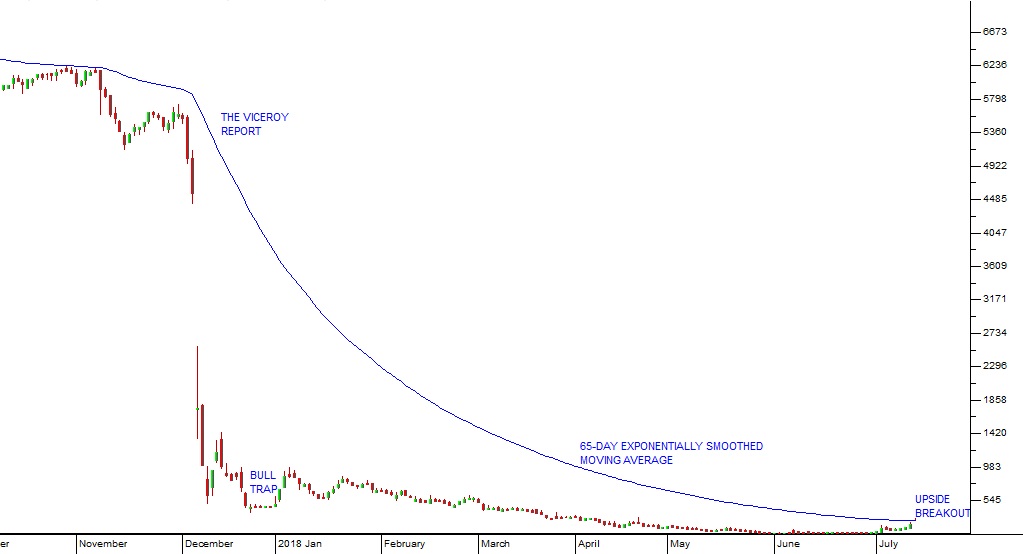
Immediately after the Viceroy report was published, Steinhoff fell from around R55 to below 465c and hovered there for just over a week. Then it began to rally, reaching as [glossary_exclude]high[/glossary_exclude] as 860c. This is a classic “bull trap”. Excited private investors jump in thinking the bad news is all discounted and the company cannot possibly have wiped out a net asset value of over R56 per share.
But there was more bad news to come and those who piled in too early were severely punished. Over the next six months a steady stream of negative reports came out on every aspect of the Steinhoff debacle. Each one of them pushed the share price lower. Its lowest closing price was just 107c reached on 4th June 2018. Consider the chart: