FirstRand
15 May 2019 By PDSNET
The financial sector has been under pressure lately due to an ever-changing consumer market as customers prefer working online rather than visiting a physical bank. The disruptive technologies have made banking easier and faster, allowing for transactions to be processed more efficiently.
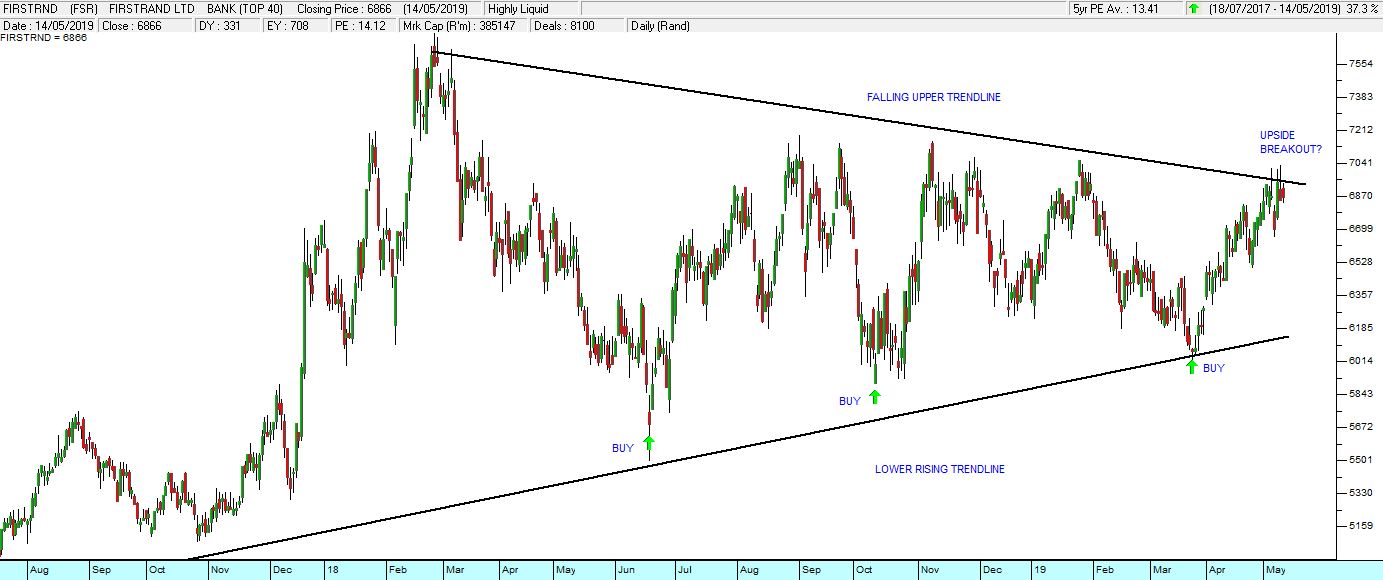
From a technical perspective, FirstRand has been moving sideways between two converging trendlines since the start of 2018, which has seen prices as [glossary_exclude]high[/glossary_exclude] as R 76,07 per share in February 2018, all the way down to R 56,88 per share in June 2018, which is +/- 25% difference in price level. This has given both traders and long-term investors some good profits. Since the start of 2018, FirstRand has given 3 possible buying opportunities, with an average return of around 19%.
On Friday the 10th of May, we had an upside breakout above 6950c which could signal a new upward trend. This may mean that FirstRand is now entering a strong bull trend and will eventually break above its previous high of 7607c made in February 2018 (which is just another 10% move). Adding that to the profits made by those investors who bought when the share was undervalued on one of the buys indicated in the chart below, would give investors nearly 30% growth within one year.
The next week or two will be crucial for FirstRand investors as their eyes are fixed on the share price to see if it will clearly break above the upper trendline. If it continues in this sideways pattern, where both trendlines are moving towards each other, the formation will eventually form a symmetrical triangle. A symmetrical triangle is formed when two trendlines converge connecting a series of peaks and troughs at a more or less equal but inverse slope.
Consider the chart: