Exploiting October Fear
11 October 2018 By PDSNET
However, in our experience this is usually overtaken by the solid performance of the economy and investors realise that the improved economic conditions will lead to rising profits among the S&P500 companies and that results in rising share prices. The second factor is the correction in tech shares. These shares have been driving the bull trend on Wall Street – mainly because of their exceptional profits and the expectation that their profits will continue to be excellent and even get better. The result of this is that the Nasdaq index – which is associated with tech shares in America – has been breaking new record highs for some time – and dragging the rest of the market up with it.
Now the Nasdaq is correcting. In the last seven days it has fallen by 7,6%. That should be seen against its 84,3% rise since March 2009 – when this bull market started. This correction is probably healthy and overdue – and it is smaller than at least three previous corrections in the Nasdaq during that time. Consider the semi-log chart of the Nasdaq over the past ten years:
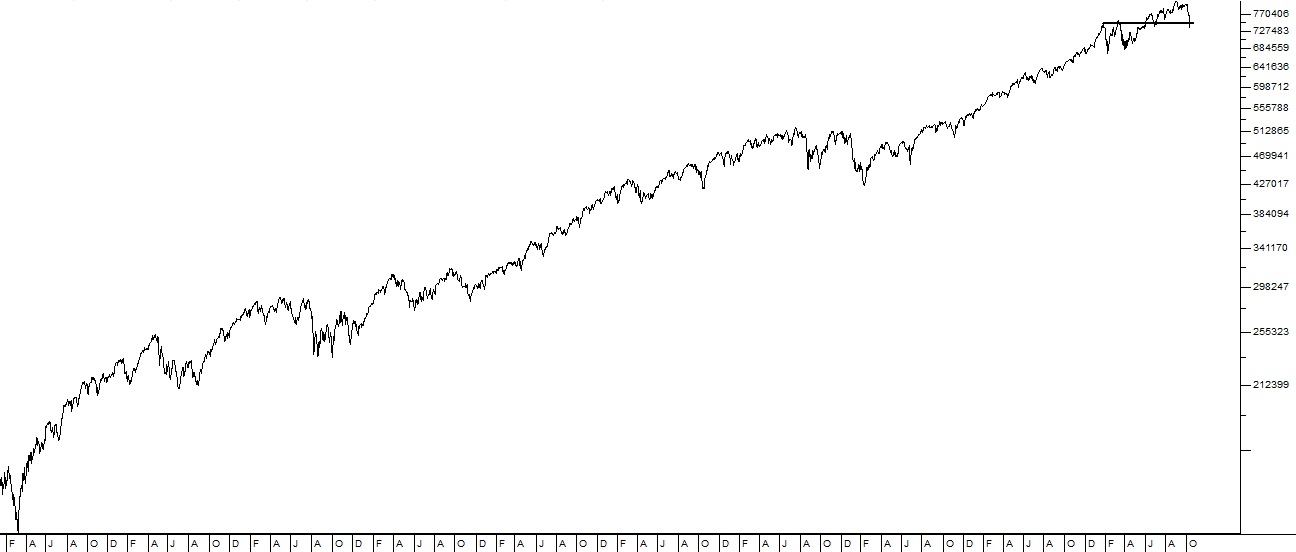
Nasdaq Composite Index October 2008 to October 2018 - Chart by ShareFriend Pro
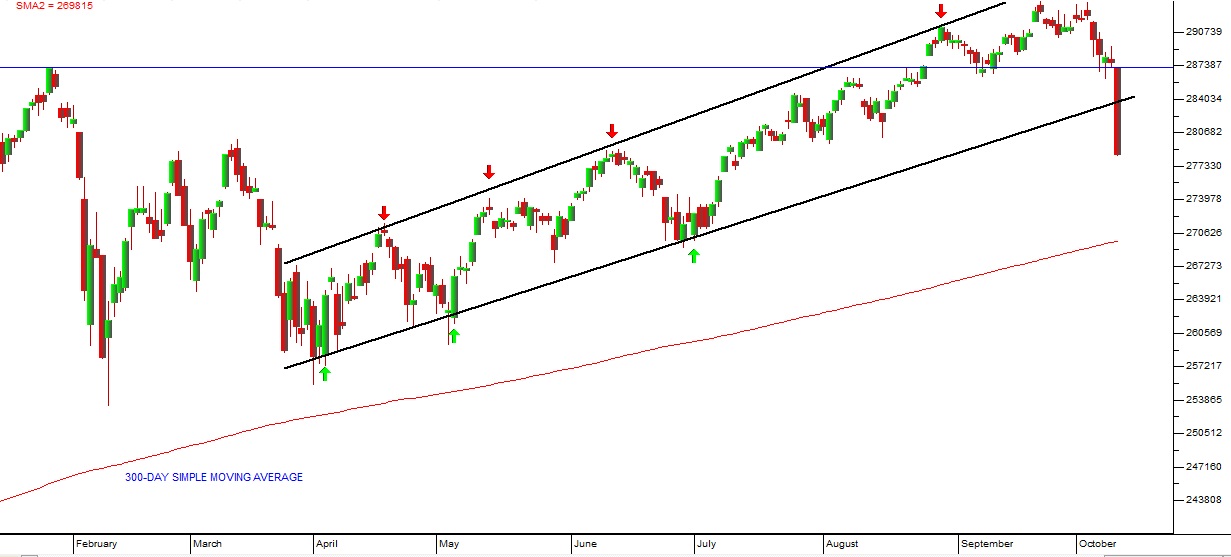
Undoubtedly, last night’s fall will impact markets around the world today, including the JSE. In our view, despite the fact that we are in the middle of October, this is not the start of a bear trend. We see it as a correction – mainly because the powerful growth of the US economy remains in place. Soon enough, positive statistics emerging from that economy will cause investor sentiment to turn and the bargain hunting will begin. In the meantime, you have to decide what you as a private investor in South Africa should do about the situation. We believe that this is a buying opportunity. So you should look for high-quality shares which are trading at very good prices and use the opportunity to buy into them or to increase your holdings and average down at lower levels. Consider the 8-month chart of the S&P500: